Bovine Mitochondrial F1-Atpase
(All numbering and residues are taken from first PDB file)
![]()
![]()
Bending Residue Dihedral Analysis
Residue
iResidue
i+1Distance of hinge axis to residue i in
(A) Distance of hinge axis to residue i in
(A) Change in
(deg) Change in
(deg) Angle of psi(i) axis to hinge axis
(deg) Angle of psi(i) axis to hinge axis
(deg) Percentage Progress
GLU-129
GLN-130
5.6
5.8
40.7
-6.7
58.0
43.5
116.5
GLN-130
GLU-131
3.1
3.7
49.6
-29.0
89.2
83.1
-29.4
GLU-131
ILE-132
6.1
6.1
66.0
-83.8
43.8
49.4
-30.3

Graph shows rotational transition at bending residues and can be used
to identify hinge bending residues.
Probably only informative for interdomain rotations greater than 20 degrees
Residue
iResidue
i+1Distance of hinge axis to residue i in
(A) Distance of hinge axis to residue i in
(A) Change in
(deg) Change in
(deg) Angle of psi(i) axis to hinge axis
(deg) Angle of psi(i) axis to hinge axis
(deg) Percentage Progress
GLY-149
GLY-150
5.6
5.4
-8.1
-10.2
89.0
80.4
6.2
GLY-150
LYS-151
2.1
2.5
-0.3
-9.4
22.9
14.2
40.5
LYS-151
ILE-152
2.7
2.8
6.2
-4.3
102.9
91.6
-0.2
ILE-152
GLY-153
2.4
3.1
-22.6
47.5
35.5
31.6
-112.5

Graph shows rotational transition at bending residues and can be used
to identify hinge bending residues.
Probably only informative for interdomain rotations greater than 20 degrees
Residue
iResidue
i+1Distance of hinge axis to residue i in
(A) Distance of hinge axis to residue i in
(A) Change in
(deg) Change in
(deg) Angle of psi(i) axis to hinge axis
(deg) Angle of psi(i) axis to hinge axis
(deg) Percentage Progress
ILE-170
ASN-171
9.7
10.2
2.3
0.9
84.8
89.9
-14.6
ASN-171
ASN-172
13.4
13.7
9.3
7.7
17.9
24.6
71.2
ASN-172
VAL-173
13.9
14.5
-38.8
75.0
129.0
120.6
96.5
VAL-173
ALA-174
11.9
13.0
158.3
-125.1
114.0
114.6
12.1
ALA-174
LYS-175
11.5
16.4
115.6
-107.4
99.8
40.4
92.0
LYS-175
ALA-176
15.0
17.7
-98.4
62.0
138.4
135.9
-198.3
ALA-176
HIS-177
16.6
16.9
-69.5
-22.9
113.7
86.9
-75.8
HIS-177
GLY-178
14.5
14.9
-109.8
-144.1
82.3
32.1
-225.4
GLY-178
GLY-179
17.0
16.7
-159.4
-57.2
93.8
32.6
-364.1
GLY-179
TYR-180
15.7
14.6
-161.0
2.8
21.6
40.4
718.7
TYR-180
SER-181
14.3
13.6
-32.4
5.9
85.4
80.7
-2.4

Graph shows rotational transition at bending residues and can be used
to identify hinge bending residues.
Probably only informative for interdomain rotations greater than 20 degrees
Residue
iResidue
i+1Distance of hinge axis to residue i in
(A) Distance of hinge axis to residue i in
(A) Change in
(deg) Change in
(deg) Angle of psi(i) axis to hinge axis
(deg) Angle of psi(i) axis to hinge axis
(deg) Percentage Progress
ALA-184
GLY-185
6.0
5.6
-3.0
-1.5
117.9
118.6
7.5
GLY-185
VAL-186
3.5
3.3
-14.0
20.8
104.7
109.2
25.3
VAL-186
GLY-187
5.6
5.7
0.4
17.9
59.7
48.5
114.9
GLY-187
GLU-188
6.3
5.7
7.9
38.4
83.4
77.9
93.7
GLU-188
ARG-189
3.4
2.1
-68.0
3.1
154.9
158.4
-346.3
ARG-189
THR-190
2.4
1.8
-1.8
5.5
105.3
113.0
66.3

Graph shows rotational transition at bending residues and can be used
to identify hinge bending residues.
Probably only informative for interdomain rotations greater than 20 degrees
Residue
iResidue
i+1Distance of hinge axis to residue i in
(A) Distance of hinge axis to residue i in
(A) Change in
(deg) Change in
(deg) Angle of psi(i) axis to hinge axis
(deg) Angle of psi(i) axis to hinge axis
(deg) Percentage Progress
VAL-218
TYR-219
9.5
9.1
-17.8
24.4
115.1
116.5
2.3
TYR-219
GLY-220
7.2
6.9
-10.0
33.3
118.9
108.2
50.8
GLY-220
GLN-221
7.7
7.6
21.5
-4.8
79.3
57.0
62.5
GLN-221
MET-222
4.9
5.5
-21.7
1.7
116.4
104.4
-116.3
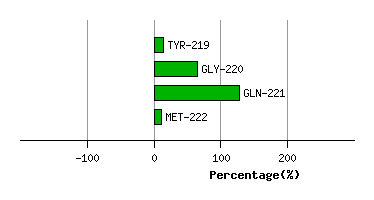
Graph shows rotational transition at bending residues and can be used
to identify hinge bending residues.
Probably only informative for interdomain rotations greater than 20 degrees
Residue
iResidue
i+1Distance of hinge axis to residue i in
(A) Distance of hinge axis to residue i in
(A) Change in
(deg) Change in
(deg) Angle of psi(i) axis to hinge axis
(deg) Angle of psi(i) axis to hinge axis
(deg) Percentage Progress
PHE-254
ILE-255
3.5
3.1
-6.6
8.6
131.2
125.5
-7.6
ILE-255
ASP-256
2.6
2.8
-21.1
18.3
111.5
113.3
25.2
ASP-256
ASN-257
1.8
2.1
-2.1
2.5
144.0
143.1
-13.0
ASN-257
ILE-258
4.7
5.0
19.5
-13.8
105.6
111.1
-24.5
ILE-258
PHE-259
7.2
7.5
0.0
-5.2
75.0
70.4
12.6

Graph shows rotational transition at bending residues and can be used
to identify hinge bending residues.
Probably only informative for interdomain rotations greater than 20 degrees
Residue
iResidue
i+1Distance of hinge axis to residue i in
(A) Distance of hinge axis to residue i in
(A) Change in
(deg) Change in
(deg) Angle of psi(i) axis to hinge axis
(deg) Angle of psi(i) axis to hinge axis
(deg) Percentage Progress
LEU-329
ASP-330
6.6
6.8
-6.7
-10.9
22.6
22.4
58.3
ASP-330
ALA-331
4.6
4.9
6.0
-16.0
84.5
85.2
13.0
ALA-331
THR-332
5.5
5.9
26.7
-4.7
27.2
21.4
106.7

Graph shows rotational transition at bending residues and can be used
to identify hinge bending residues.
Probably only informative for interdomain rotations greater than 20 degrees