Carboxyl-Terminal Src Kinase
(All numbering and residues are taken from first PDB file)
![]()
![]()
Bending Residue Dihedral Analysis
Residue
iResidue
i+1Distance of hinge axis to residue i in
(A) Distance of hinge axis to residue i in
(A) Change in
(deg) Change in
(deg) Angle of psi(i) axis to hinge axis
(deg) Angle of psi(i) axis to hinge axis
(deg) Percentage Progress
ARG-68
GLU-69
10.0
10.2
17.8
-19.0
55.0
61.8
4.3
GLU-69
GLY-70
9.4
9.2
-7.1
5.3
81.9
81.3
-4.2
GLY-70
VAL-71
7.6
7.5
9.5
-16.7
151.2
149.7
60.7

Graph shows rotational transition at bending residues and can be used
to identify hinge bending residues.
Probably only informative for interdomain rotations greater than 20 degrees
Residue
iResidue
i+1Distance of hinge axis to residue i in
(A) Distance of hinge axis to residue i in
(A) Change in
(deg) Change in
(deg) Angle of psi(i) axis to hinge axis
(deg) Angle of psi(i) axis to hinge axis
(deg) Percentage Progress
LYS-76
LEU-77
14.8
14.5
-29.3
24.6
97.9
100.3
-22.9
LEU-77
SER-78
11.0
10.7
13.0
-8.4
64.0
58.8
37.5
SER-78
LEU-79
9.8
9.2
22.6
-24.4
57.8
58.9
1.6

Graph shows rotational transition at bending residues and can be used
to identify hinge bending residues.
Probably only informative for interdomain rotations greater than 20 degrees
Residue
iResidue
i+1Distance of hinge axis to residue i in
(A) Distance of hinge axis to residue i in
(A) Change in
(deg) Change in
(deg) Angle of psi(i) axis to hinge axis
(deg) Angle of psi(i) axis to hinge axis
(deg) Percentage Progress
LYS-171
VAL-172
13.5
13.0
25.3
-11.0
24.4
14.5
111.6
VAL-172
MET-173
13.1
12.5
-25.7
44.2
108.6
115.8
95.5
MET-173
GLU-174
16.1
15.4
59.9
-51.7
56.1
63.8
56.2
GLU-174
GLY-175
16.9
17.2
-5.4
5.7
10.9
3.4
0.5
GLU-174
GLY-175
16.9
17.2
-5.4
5.7
10.9
3.4
0.5

Graph shows rotational transition at bending residues and can be used
to identify hinge bending residues.
Probably only informative for interdomain rotations greater than 20 degrees
Residue
iResidue
i+1Distance of hinge axis to residue i in
(A) Distance of hinge axis to residue i in
(A) Change in
(deg) Change in
(deg) Angle of psi(i) axis to hinge axis
(deg) Angle of psi(i) axis to hinge axis
(deg) Percentage Progress
GLU-174
GLY-175
16.9
17.2
-5.4
5.7
10.9
3.4
0.5
GLU-174
GLY-175
16.9
17.2
-5.4
5.7
10.9
3.4
0.5
GLY-175
THR-176
17.1
16.8
-32.8
52.0
61.6
71.1
-26.7
THR-176
VAL-177
13.6
13.2
3.7
-16.4
98.1
110.2
80.0
VAL-177
ALA-178
11.1
10.9
-13.7
3.5
94.8
93.3
21.5
ALA-178
ALA-179
7.5
7.4
-0.1
-6.8
30.9
30.9
53.2
ALA-179
GLN-180
5.6
5.4
11.6
-5.6
86.9
83.0
-7.7
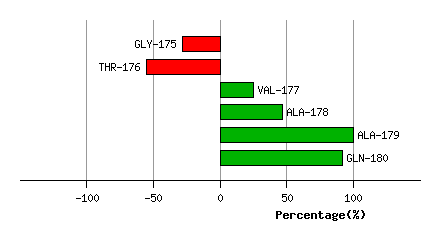
Graph shows rotational transition at bending residues and can be used
to identify hinge bending residues.
Probably only informative for interdomain rotations greater than 20 degrees
Residue
iResidue
i+1Distance of hinge axis to residue i in
(A) Distance of hinge axis to residue i in
(A) Change in
(deg) Change in
(deg) Angle of psi(i) axis to hinge axis
(deg) Angle of psi(i) axis to hinge axis
(deg) Percentage Progress
ASP-181
GLU-182
6.4
6.3
47.0
-28.7
13.0
26.6
142.7
GLU-182
PHE-183
7.3
7.1
4.6
-9.6
57.1
49.1
-2.0
PHE-183
TYR-184
4.4
4.4
22.5
-3.4
98.7
102.0
-22.9
TYR-184
ARG-185
6.6
6.6
-0.1
-11.1
108.7
113.5
-44.0
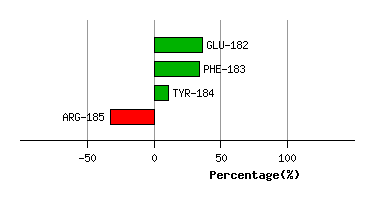
Graph shows rotational transition at bending residues and can be used
to identify hinge bending residues.
Probably only informative for interdomain rotations greater than 20 degrees
Residue
iResidue
i+1Distance of hinge axis to residue i in
(A) Distance of hinge axis to residue i in
(A) Change in
(deg) Change in
(deg) Angle of psi(i) axis to hinge axis
(deg) Angle of psi(i) axis to hinge axis
(deg) Percentage Progress
LEU-234
ALA-235
7.1
7.2
6.9
-12.6
22.7
18.3
-39.4
ALA-235
GLU-236
9.3
9.0
9.9
-1.6
45.7
46.7
63.7
GLU-236
ALA-237
7.5
7.3
-10.1
13.8
86.7
89.3
9.2

Graph shows rotational transition at bending residues and can be used
to identify hinge bending residues.
Probably only informative for interdomain rotations greater than 20 degrees
Residue
iResidue
i+1Distance of hinge axis to residue i in
(A) Distance of hinge axis to residue i in
(A) Change in
(deg) Change in
(deg) Angle of psi(i) axis to hinge axis
(deg) Angle of psi(i) axis to hinge axis
(deg) Percentage Progress
LEU-248
VAL-249
4.6
4.5
0.4
2.6
47.3
45.9
10.1
VAL-249
GLN-250
6.6
6.7
12.2
-11.9
55.6
52.3
-10.3
GLN-250
LEU-251
5.2
5.4
1.9
7.6
9.6
6.4
84.1
LEU-251
LEU-252
4.4
4.4
6.6
-9.4
105.8
108.9
35.3
LEU-251
LEU-252
4.4
4.4
6.6
-9.4
105.8
108.9
35.3

Graph shows rotational transition at bending residues and can be used
to identify hinge bending residues.
Probably only informative for interdomain rotations greater than 20 degrees
Residue
iResidue
i+1Distance of hinge axis to residue i in
(A) Distance of hinge axis to residue i in
(A) Change in
(deg) Change in
(deg) Angle of psi(i) axis to hinge axis
(deg) Angle of psi(i) axis to hinge axis
(deg) Percentage Progress
LEU-251
LEU-252
4.4
4.4
6.6
-9.4
105.8
108.9
35.3
LEU-251
LEU-252
4.4
4.4
6.6
-9.4
105.8
108.9
35.3
LEU-252
GLY-253
7.2
7.1
-5.6
-3.1
26.4
28.0
61.4
GLY-253
VAL-254
5.7
5.2
11.3
-3.7
122.1
123.8
-88.0

Graph shows rotational transition at bending residues and can be used
to identify hinge bending residues.
Probably only informative for interdomain rotations greater than 20 degrees
Residue
iResidue
i+1Distance of hinge axis to residue i in
(A) Distance of hinge axis to residue i in
(A) Change in
(deg) Change in
(deg) Angle of psi(i) axis to hinge axis
(deg) Angle of psi(i) axis to hinge axis
(deg) Percentage Progress
GLY-260
GLY-261
8.0
8.7
-25.4
15.2
26.8
27.7
94.4
GLY-261
LEU-262
9.1
9.8
-26.8
14.3
43.4
45.7
64.0
LEU-262
TYR-263
7.7
8.0
11.8
-7.3
145.4
150.7
-23.6
TYR-263
ILE-264
8.2
8.2
-2.1
10.8
136.5
136.3
41.1
TYR-263
ILE-264
8.2
8.2
-2.1
10.8
136.5
136.3
41.1

Graph shows rotational transition at bending residues and can be used
to identify hinge bending residues.
Probably only informative for interdomain rotations greater than 20 degrees
Residue
iResidue
i+1Distance of hinge axis to residue i in
(A) Distance of hinge axis to residue i in
(A) Change in
(deg) Change in
(deg) Angle of psi(i) axis to hinge axis
(deg) Angle of psi(i) axis to hinge axis
(deg) Percentage Progress
TYR-263
ILE-264
8.2
8.2
-2.1
10.8
136.5
136.3
41.1
TYR-263
ILE-264
8.2
8.2
-2.1
10.8
136.5
136.3
41.1
ILE-264
VAL-265
6.9
6.9
-6.4
9.7
120.6
116.5
10.3
VAL-265
THR-266
8.4
8.3
14.0
-13.7
19.7
16.8
16.6

Graph shows rotational transition at bending residues and can be used
to identify hinge bending residues.
Probably only informative for interdomain rotations greater than 20 degrees