Glutamate Receptor, Ionotropic Kainate 1
(All numbering and residues are taken from first PDB file)
![]()
![]()
Bending Residue Dihedral Analysis
Residue
iResidue
i+1Distance of hinge axis to residue i in
(A) Distance of hinge axis to residue i in
(A) Change in
(deg) Change in
(deg) Angle of psi(i) axis to hinge axis
(deg) Angle of psi(i) axis to hinge axis
(deg) Percentage Progress
TYR-16
VAL-17
5.0
5.0
1.1
-3.3
84.1
80.8
-24.2
VAL-17
MET-18
8.7
8.7
-0.4
4.6
142.8
141.1
64.7
MET-18
TYR-19
10.1
10.1
-6.0
12.7
112.1
112.6
-0.1

Graph shows rotational transition at bending residues and can be used
to identify hinge bending residues.
Probably only informative for interdomain rotations greater than 20 degrees
Residue
iResidue
i+1Distance of hinge axis to residue i in
(A) Distance of hinge axis to residue i in
(A) Change in
(deg) Change in
(deg) Angle of psi(i) axis to hinge axis
(deg) Angle of psi(i) axis to hinge axis
(deg) Percentage Progress
PHE-32
GLU-33
14.1
14.0
-2.6
1.5
80.5
75.9
37.6
GLU-33
GLY-34
11.1
11.0
-2.9
6.5
110.4
111.6
22.3
GLY-34
TYR-35
7.6
7.6
9.6
-11.0
45.3
45.3
-45.7

Graph shows rotational transition at bending residues and can be used
to identify hinge bending residues.
Probably only informative for interdomain rotations greater than 20 degrees
Residue
iResidue
i+1Distance of hinge axis to residue i in
(A) Distance of hinge axis to residue i in
(A) Change in
(deg) Change in
(deg) Angle of psi(i) axis to hinge axis
(deg) Angle of psi(i) axis to hinge axis
(deg) Percentage Progress
PRO-104
PHE-105
4.1
4.0
-8.2
-1.4
139.2
135.8
-113.1
PHE-105
MET-106
5.5
5.6
4.4
0.2
49.6
47.6
23.3
MET-106
THR-107
4.2
4.1
-13.6
6.5
56.3
57.7
38.7

Graph shows rotational transition at bending residues and can be used
to identify hinge bending residues.
Probably only informative for interdomain rotations greater than 20 degrees
Residue
iResidue
i+1Distance of hinge axis to residue i in
(A) Distance of hinge axis to residue i in
(A) Change in
(deg) Change in
(deg) Angle of psi(i) axis to hinge axis
(deg) Angle of psi(i) axis to hinge axis
(deg) Percentage Progress
ASP-212
SER-213
12.8
12.8
5.6
0.2
108.6
105.4
8.7
SER-213
LYS-214
10.0
9.9
-3.2
2.0
118.4
112.2
47.6
LYS-214
GLY-215
6.3
6.1
-3.9
1.7
52.8
49.9
-9.1
GLY-215
TYR-216
3.0
2.9
3.2
0.4
95.6
97.3
48.5
TYR-216
GLY-217
0.6
0.8
1.2
-1.6
61.0
60.3
1.5
GLY-217
VAL-218
3.4
3.4
-5.5
8.9
78.0
78.5
35.4

Graph shows rotational transition at bending residues and can be used
to identify hinge bending residues.
Probably only informative for interdomain rotations greater than 20 degrees
Residue
iResidue
i+1Distance of hinge axis to residue i in
(A) Distance of hinge axis to residue i in
(A) Change in
(deg) Change in
(deg) Angle of psi(i) axis to hinge axis
(deg) Angle of psi(i) axis to hinge axis
(deg) Percentage Progress
LYS-247
GLU-248
6.4
6.3
5.2
3.1
20.5
23.8
114.9
GLU-248
LYS-249
8.1
8.1
-11.0
11.1
134.0
135.0
-25.6
LYS-249
TRP-250
7.5
7.5
-9.9
3.2
99.9
98.7
-28.3
TRP-250
TRP-251
3.9
3.9
5.7
0.5
79.1
81.5
-28.6
TRP-251
ARG-252
3.6
3.4
6.1
-4.7
33.5
31.9
17.8
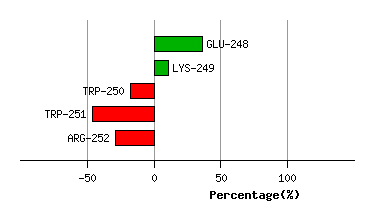
Graph shows rotational transition at bending residues and can be used
to identify hinge bending residues.
Probably only informative for interdomain rotations greater than 20 degrees