Glutamate Receptor, Ionotropic Kainate 1
(All numbering and residues are taken from first PDB file)
![]()
![]()
Bending Residue Dihedral Analysis
Residue
iResidue
i+1Distance of hinge axis to residue i in
(A) Distance of hinge axis to residue i in
(A) Change in
(deg) Change in
(deg) Angle of psi(i) axis to hinge axis
(deg) Angle of psi(i) axis to hinge axis
(deg) Percentage Progress
GLY-109
ILE-110
5.4
5.3
-33.8
27.3
95.8
97.9
-3.6
ILE-110
SER-111
4.8
4.5
-2.5
-8.3
62.1
66.9
66.0
GLY-109
ILE-110
2.9
3.0
-33.8
27.3
59.6
62.3
34.3
ILE-110
SER-111
3.5
3.6
-2.5
-8.3
48.5
49.1
61.3
SER-111
ILE-112
5.6
5.7
8.4
-7.6
118.1
119.0
3.3
GLY-109
ILE-110
1.1
0.7
-33.8
27.3
22.8
18.9
97.2
ILE-110
SER-111
2.9
2.9
-2.5
-8.3
53.0
57.5
72.6
SER-111
ILE-112
1.9
2.2
8.4
-7.6
158.8
158.8
-23.4
GLY-109
ILE-110
5.4
5.3
-33.8
27.3
95.8
97.9
-3.6
ILE-110
SER-111
4.8
4.5
-2.5
-8.3
62.1
66.9
66.0
GLY-109
ILE-110
2.9
3.0
-33.8
27.3
59.6
62.3
34.3
ILE-110
SER-111
3.5
3.6
-2.5
-8.3
48.5
49.1
61.3
SER-111
ILE-112
5.6
5.7
8.4
-7.6
118.1
119.0
3.3
GLY-109
ILE-110
1.1
0.7
-33.8
27.3
22.8
18.9
97.2
ILE-110
SER-111
2.9
2.9
-2.5
-8.3
53.0
57.5
72.6
SER-111
ILE-112
1.9
2.2
8.4
-7.6
158.8
158.8
-23.4
ILE-112
LEU-113
2.4
2.4
2.6
1.7
122.9
122.9
9.7
GLY-109
ILE-110
5.4
5.3
-33.8
27.3
95.8
97.9
-3.6
ILE-110
SER-111
4.8
4.5
-2.5
-8.3
62.1
66.9
66.0
GLY-109
ILE-110
2.9
3.0
-33.8
27.3
59.6
62.3
34.3
ILE-110
SER-111
3.5
3.6
-2.5
-8.3
48.5
49.1
61.3
SER-111
ILE-112
5.6
5.7
8.4
-7.6
118.1
119.0
3.3
GLY-109
ILE-110
1.1
0.7
-33.8
27.3
22.8
18.9
97.2
ILE-110
SER-111
2.9
2.9
-2.5
-8.3
53.0
57.5
72.6
SER-111
ILE-112
1.9
2.2
8.4
-7.6
158.8
158.8
-23.4
ILE-112
LEU-113
2.4
2.4
2.6
1.7
122.9
122.9
9.7
LEU-113
TYR-114
0.4
0.4
13.1
-0.8
157.6
153.2
-80.6

Graph shows rotational transition at bending residues and can be used
to identify hinge bending residues.
Probably only informative for interdomain rotations greater than 20 degrees
Residue
iResidue
i+1Distance of hinge axis to residue i in
(A) Distance of hinge axis to residue i in
(A) Change in
(deg) Change in
(deg) Angle of psi(i) axis to hinge axis
(deg) Angle of psi(i) axis to hinge axis
(deg) Percentage Progress
TYR-185
ALA-186
5.7
5.5
-3.3
4.1
136.2
140.8
43.4
ALA-186
LEU-187
4.4
4.4
-2.4
3.3
137.7
134.0
0.4
LEU-187
LEU-188
4.9
4.8
-2.6
4.5
155.3
159.7
44.0
LEU-188
MET-189
5.1
5.2
-11.7
5.7
60.7
62.3
86.8
LEU-188
MET-189
5.1
5.2
-11.7
5.7
60.7
62.3
86.8

Graph shows rotational transition at bending residues and can be used
to identify hinge bending residues.
Probably only informative for interdomain rotations greater than 20 degrees
Residue
iResidue
i+1Distance of hinge axis to residue i in
(A) Distance of hinge axis to residue i in
(A) Change in
(deg) Change in
(deg) Angle of psi(i) axis to hinge axis
(deg) Angle of psi(i) axis to hinge axis
(deg) Percentage Progress
LEU-188
MET-189
5.1
5.2
-11.7
5.7
60.7
62.3
86.8
LEU-188
MET-189
5.1
5.2
-11.7
5.7
60.7
62.3
86.8
MET-189
GLU-190
4.8
4.7
12.3
-5.2
143.1
137.8
-53.9
GLU-190
SER-191
4.4
4.2
3.4
-4.0
74.6
72.8
-1.6
SER-191
THR-192
2.5
2.9
-1.0
7.1
92.9
90.5
48.9
THR-192
SER-193
6.2
6.6
4.0
-10.5
35.6
30.9
-80.7
THR-192
SER-193
6.2
6.6
4.0
-10.5
35.6
30.9
-80.7

Graph shows rotational transition at bending residues and can be used
to identify hinge bending residues.
Probably only informative for interdomain rotations greater than 20 degrees
Residue
iResidue
i+1Distance of hinge axis to residue i in
(A) Distance of hinge axis to residue i in
(A) Change in
(deg) Change in
(deg) Angle of psi(i) axis to hinge axis
(deg) Angle of psi(i) axis to hinge axis
(deg) Percentage Progress
THR-192
SER-193
6.2
6.6
4.0
-10.5
35.6
30.9
-80.7
THR-192
SER-193
6.2
6.6
4.0
-10.5
35.6
30.9
-80.7
SER-193
ILE-194
7.5
7.5
12.2
-11.0
34.1
38.3
39.5
ILE-194
GLU-195
5.0
5.2
-5.0
10.0
94.5
91.7
41.7
GLU-195
TYR-196
7.4
8.0
-9.0
7.2
70.8
64.4
-9.5
GLU-195
TYR-196
7.4
8.0
-9.0
7.2
70.8
64.4
-9.5
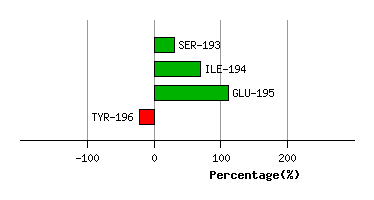
Graph shows rotational transition at bending residues and can be used
to identify hinge bending residues.
Probably only informative for interdomain rotations greater than 20 degrees
Residue
iResidue
i+1Distance of hinge axis to residue i in
(A) Distance of hinge axis to residue i in
(A) Change in
(deg) Change in
(deg) Angle of psi(i) axis to hinge axis
(deg) Angle of psi(i) axis to hinge axis
(deg) Percentage Progress
GLU-195
TYR-196
7.4
8.0
-9.0
7.2
70.8
64.4
-9.5
GLU-195
TYR-196
7.4
8.0
-9.0
7.2
70.8
64.4
-9.5
TYR-196
VAL-197
10.3
10.5
-4.4
2.6
5.6
3.4
46.9
VAL-197
THR-198
9.1
9.2
-9.4
-7.8
58.2
60.8
82.2

Graph shows rotational transition at bending residues and can be used
to identify hinge bending residues.
Probably only informative for interdomain rotations greater than 20 degrees
Residue
iResidue
i+1Distance of hinge axis to residue i in
(A) Distance of hinge axis to residue i in
(A) Change in
(deg) Change in
(deg) Angle of psi(i) axis to hinge axis
(deg) Angle of psi(i) axis to hinge axis
(deg) Percentage Progress
LEU-204
THR-205
5.5
5.6
1.2
-10.7
133.6
138.0
70.3
THR-205
GLN-206
5.8
5.9
-0.8
14.3
43.0
47.5
-131.9
GLN-206
ILE-207
4.6
4.7
18.5
-0.7
94.2
82.0
-2.4

Graph shows rotational transition at bending residues and can be used
to identify hinge bending residues.
Probably only informative for interdomain rotations greater than 20 degrees