Protein (Surface Antigen Psaa)
(All numbering and residues are taken from first PDB file)
![]()
![]()
Bending Residue Dihedral Analysis
Residue
iResidue
i+1Distance of hinge axis to residue i in
(A) Distance of hinge axis to residue i in
(A) Change in
(deg) Change in
(deg) Angle of psi(i) axis to hinge axis
(deg) Angle of psi(i) axis to hinge axis
(deg) Percentage Progress
LYS-188
ASP-189
11.9
12.0
5.5
-6.2
110.2
115.3
-68.8
ASP-189
LYS-190
14.7
14.8
1.4
5.0
75.9
77.7
-30.6
LYS-190
PHE-191
13.4
13.5
-3.8
-3.7
59.6
56.6
212.9

Graph shows rotational transition at bending residues and can be used
to identify hinge bending residues.
Probably only informative for interdomain rotations greater than 20 degrees
Residue
iResidue
i+1Distance of hinge axis to residue i in
(A) Distance of hinge axis to residue i in
(A) Change in
(deg) Change in
(deg) Angle of psi(i) axis to hinge axis
(deg) Angle of psi(i) axis to hinge axis
(deg) Percentage Progress
VAL-202
THR-203
6.9
6.9
0.7
-3.8
161.9
161.7
20.0
THR-203
SER-204
6.9
7.0
-0.6
5.2
87.5
88.6
156.3
SER-204
GLU-205
10.0
10.0
0.7
-8.4
61.3
61.7
-75.9
GLU-205
GLY-206
10.0
9.9
0.5
-5.4
44.6
45.8
-127.9

Graph shows rotational transition at bending residues and can be used
to identify hinge bending residues.
Probably only informative for interdomain rotations greater than 20 degrees
Residue
iResidue
i+1Distance of hinge axis to residue i in
(A) Distance of hinge axis to residue i in
(A) Change in
(deg) Change in
(deg) Angle of psi(i) axis to hinge axis
(deg) Angle of psi(i) axis to hinge axis
(deg) Percentage Progress
ALA-207
PHE-208
7.6
7.7
-0.4
1.4
107.7
104.3
57.4
PHE-208
LYS-209
4.6
4.6
-3.5
1.9
160.6
159.3
-68.3
LYS-209
TYR-210
6.3
6.1
2.3
-2.6
81.4
83.4
30.2
TYR-210
PHE-211
7.7
7.6
2.4
-1.2
93.6
93.9
26.9
PHE-211
SER-212
5.0
5.0
-1.1
2.9
151.4
152.3
30.3
SER-212
LYS-213
3.0
3.0
0.3
1.6
43.1
44.6
-2.6

Graph shows rotational transition at bending residues and can be used
to identify hinge bending residues.
Probably only informative for interdomain rotations greater than 20 degrees
Residue
iResidue
i+1Distance of hinge axis to residue i in
(A) Distance of hinge axis to residue i in
(A) Change in
(deg) Change in
(deg) Angle of psi(i) axis to hinge axis
(deg) Angle of psi(i) axis to hinge axis
(deg) Percentage Progress
VAL-217
PRO-218
2.8
2.9
-2.9
0.9
86.0
87.1
-37.2
PRO-218
SER-219
1.7
1.5
2.3
-0.4
34.1
36.9
75.7
SER-219
ALA-220
4.1
4.0
-2.1
5.5
78.2
76.0
94.1
ALA-220
TYR-221
7.7
7.6
-0.1
-1.0
20.8
20.7
49.5
ALA-220
TYR-221
7.7
7.6
-0.1
-1.0
20.8
20.7
49.5

Graph shows rotational transition at bending residues and can be used
to identify hinge bending residues.
Probably only informative for interdomain rotations greater than 20 degrees
Residue
iResidue
i+1Distance of hinge axis to residue i in
(A) Distance of hinge axis to residue i in
(A) Change in
(deg) Change in
(deg) Angle of psi(i) axis to hinge axis
(deg) Angle of psi(i) axis to hinge axis
(deg) Percentage Progress
ALA-220
TYR-221
7.7
7.6
-0.1
-1.0
20.8
20.7
49.5
ALA-220
TYR-221
7.7
7.6
-0.1
-1.0
20.8
20.7
49.5
TYR-221
ILE-222
9.8
9.8
-0.9
0.1
87.1
87.9
-25.6
ILE-222
TRP-223
13.3
13.2
9.5
-15.2
81.3
81.1
45.3
TRP-223
GLU-224
14.3
14.2
-0.3
-5.2
75.3
80.2
-65.9
TRP-223
GLU-224
14.3
14.2
-0.3
-5.2
75.3
80.2
-65.9
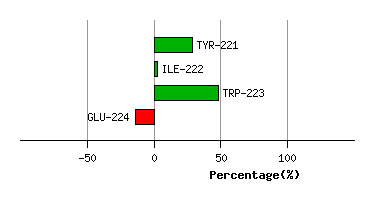
Graph shows rotational transition at bending residues and can be used
to identify hinge bending residues.
Probably only informative for interdomain rotations greater than 20 degrees
Residue
iResidue
i+1Distance of hinge axis to residue i in
(A) Distance of hinge axis to residue i in
(A) Change in
(deg) Change in
(deg) Angle of psi(i) axis to hinge axis
(deg) Angle of psi(i) axis to hinge axis
(deg) Percentage Progress
TRP-223
GLU-224
14.3
14.2
-0.3
-5.2
75.3
80.2
-65.9
TRP-223
GLU-224
14.3
14.2
-0.3
-5.2
75.3
80.2
-65.9
GLU-224
ILE-225
14.0
13.6
-1.9
3.7
139.4
140.1
50.8
ILE-225
ASN-226
14.2
13.8
-1.2
-11.4
91.1
91.1
-7.3
ASN-226
THR-227
17.8
17.4
17.2
-18.6
94.9
108.9
-15.9
THR-227
GLU-228
18.6
18.4
-9.5
15.4
150.8
149.2
223.1
GLU-228
GLU-229
21.4
21.3
-8.8
16.1
119.9
115.9
-28.5
GLU-229
GLU-230
21.1
21.1
6.2
-13.5
107.0
98.9
-65.6
GLU-230
GLY-231
17.7
17.7
-6.8
1.9
99.1
100.2
-32.0
GLY-231
THR-232
17.8
17.8
-5.2
1.6
82.6
83.5
99.7
THR-232
PRO-233
21.3
21.3
-4.0
3.1
59.8
61.0
-30.8

Graph shows rotational transition at bending residues and can be used
to identify hinge bending residues.
Probably only informative for interdomain rotations greater than 20 degrees
Residue
iResidue
i+1Distance of hinge axis to residue i in
(A) Distance of hinge axis to residue i in
(A) Change in
(deg) Change in
(deg) Angle of psi(i) axis to hinge axis
(deg) Angle of psi(i) axis to hinge axis
(deg) Percentage Progress
GLN-276
ILE-277
5.4
5.4
3.8
-4.5
74.1
75.8
-110.5
ILE-277
PHE-278
1.9
2.0
-4.3
9.3
71.4
73.0
47.2
PHE-278
THR-279
1.7
1.7
3.4
14.9
41.0
40.9
495.7
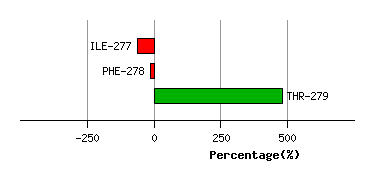
Graph shows rotational transition at bending residues and can be used
to identify hinge bending residues.
Probably only informative for interdomain rotations greater than 20 degrees
Residue
iResidue
i+1Distance of hinge axis to residue i in
(A) Distance of hinge axis to residue i in
(A) Change in
(deg) Change in
(deg) Angle of psi(i) axis to hinge axis
(deg) Angle of psi(i) axis to hinge axis
(deg) Percentage Progress
LYS-297
TYR-298
10.1
10.1
-2.1
-0.6
102.7
97.8
-20.2
TYR-298
ASN-299
7.7
7.7
-2.3
-1.5
41.5
39.9
8.5
ASN-299
LEU-300
5.1
5.1
-3.9
2.3
38.0
33.0
27.6
LEU-300
ASP-301
7.7
7.4
-6.3
1.1
98.1
93.0
96.9
ASP-301
LYS-302
10.1
10.1
5.2
-1.8
91.8
88.5
17.7
LYS-302
ILE-303
8.4
8.4
-2.9
6.6
25.4
30.7
-71.6
ILE-303
ALA-304
7.0
6.7
-3.1
2.2
51.8
49.9
24.9
ALA-304
GLU-305
10.1
9.7
-3.9
7.1
105.4
103.7
92.8

Graph shows rotational transition at bending residues and can be used
to identify hinge bending residues.
Probably only informative for interdomain rotations greater than 20 degrees