Maf-Like Protein Ycef
(All numbering and residues are taken from first PDB file)
![]()
![]()
Bending Residue Dihedral Analysis
Residue
iResidue
i+1Distance of hinge axis to residue i in
(A) Distance of hinge axis to residue i in
(A) Change in
(deg) Change in
(deg) Angle of psi(i) axis to hinge axis
(deg) Angle of psi(i) axis to hinge axis
(deg) Percentage Progress
GLY-77
GLU-78
7.6
7.1
-9.6
0.4
96.2
91.1
16.1
GLU-78
VAL-79
10.1
9.7
-3.2
-1.9
24.4
28.0
78.5
VAL-79
LEU-80
12.8
12.5
1.0
-11.4
95.8
98.8
49.6
LEU-80
GLU-81
13.9
13.8
-15.4
2.5
56.8
50.7
167.1
GLU-81
LYS-82
17.5
17.3
15.6
-15.0
127.9
122.5
-191.3
LYS-82
PRO-83
19.6
19.7
6.5
-10.7
47.0
52.7
-97.3

Graph shows rotational transition at bending residues and can be used
to identify hinge bending residues.
Probably only informative for interdomain rotations greater than 20 degrees
Residue
iResidue
i+1Distance of hinge axis to residue i in
(A) Distance of hinge axis to residue i in
(A) Change in
(deg) Change in
(deg) Angle of psi(i) axis to hinge axis
(deg) Angle of psi(i) axis to hinge axis
(deg) Percentage Progress
HIS-101
GLN-102
4.3
4.2
-1.4
4.4
123.0
121.6
82.2
GLN-102
VAL-103
6.1
6.0
-0.7
7.0
112.6
106.6
48.0
VAL-103
MET-104
9.1
9.1
3.0
0.9
82.7
84.3
35.5

Graph shows rotational transition at bending residues and can be used
to identify hinge bending residues.
Probably only informative for interdomain rotations greater than 20 degrees
Residue
iResidue
i+1Distance of hinge axis to residue i in
(A) Distance of hinge axis to residue i in
(A) Change in
(deg) Change in
(deg) Angle of psi(i) axis to hinge axis
(deg) Angle of psi(i) axis to hinge axis
(deg) Percentage Progress
THR-122
ASP-123
6.6
6.8
-3.9
16.9
127.6
127.5
126.1
ASP-123
VAL-124
3.1
3.3
6.7
-5.4
125.5
125.6
-101.7
VAL-124
THR-125
3.3
3.5
8.9
-6.7
61.3
63.2
42.3

Graph shows rotational transition at bending residues and can be used
to identify hinge bending residues.
Probably only informative for interdomain rotations greater than 20 degrees
Residue
iResidue
i+1Distance of hinge axis to residue i in
(A) Distance of hinge axis to residue i in
(A) Change in
(deg) Change in
(deg) Angle of psi(i) axis to hinge axis
(deg) Angle of psi(i) axis to hinge axis
(deg) Percentage Progress
VAL-138
ALA-139
22.8
22.5
9.0
-8.0
60.9
62.5
-14.6
ALA-139
SER-140
26.0
25.7
-0.6
-5.4
145.1
150.5
-186.8
SER-140
ASP-141
24.4
23.9
145.9
-150.8
100.2
130.1
162.1
ASP-141
GLU-142
24.4
24.3
6.8
13.8
97.9
93.0
18.2
ASP-141
GLU-142
24.4
24.3
6.8
13.8
97.9
93.0
18.2

Graph shows rotational transition at bending residues and can be used
to identify hinge bending residues.
Probably only informative for interdomain rotations greater than 20 degrees
Residue
iResidue
i+1Distance of hinge axis to residue i in
(A) Distance of hinge axis to residue i in
(A) Change in
(deg) Change in
(deg) Angle of psi(i) axis to hinge axis
(deg) Angle of psi(i) axis to hinge axis
(deg) Percentage Progress
ASP-141
GLU-142
24.4
24.3
6.8
13.8
97.9
93.0
18.2
ASP-141
GLU-142
24.4
24.3
6.8
13.8
97.9
93.0
18.2
GLU-142
PRO-143
21.0
20.9
1.3
-10.6
33.1
32.7
-144.6
PRO-143
LEU-144
19.5
19.5
-0.5
7.6
115.1
117.2
146.2
LEU-144
ASP-145
22.5
22.5
-0.4
0.6
86.3
92.4
-130.4
ASP-145
LYS-146
21.9
22.1
-13.0
15.0
89.8
90.1
29.0
LYS-146
ALA-147
18.2
18.4
6.4
-0.4
24.0
26.3
93.7
ALA-147
GLY-148
16.3
16.3
-1.1
6.3
92.9
88.2
-30.6

Graph shows rotational transition at bending residues and can be used
to identify hinge bending residues.
Probably only informative for interdomain rotations greater than 20 degrees
Residue
iResidue
i+1Distance of hinge axis to residue i in
(A) Distance of hinge axis to residue i in
(A) Change in
(deg) Change in
(deg) Angle of psi(i) axis to hinge axis
(deg) Angle of psi(i) axis to hinge axis
(deg) Percentage Progress
TYR-150
GLY-151
14.6
14.8
3.7
-6.4
53.8
51.4
11.1
GLY-151
ILE-152
13.9
14.1
-3.1
-2.9
127.4
128.0
-24.9
ILE-152
GLN-153
10.8
11.1
-9.3
28.3
161.4
162.0
244.6
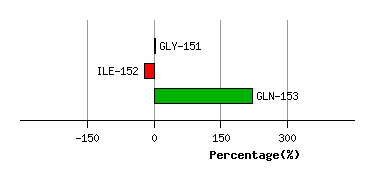
Graph shows rotational transition at bending residues and can be used
to identify hinge bending residues.
Probably only informative for interdomain rotations greater than 20 degrees
Residue
iResidue
i+1Distance of hinge axis to residue i in
(A) Distance of hinge axis to residue i in
(A) Change in
(deg) Change in
(deg) Angle of psi(i) axis to hinge axis
(deg) Angle of psi(i) axis to hinge axis
(deg) Percentage Progress
GLY-154
LEU-155
15.5
15.5
10.0
-1.3
75.9
76.4
89.4
LEU-155
GLY-156
16.4
16.2
1.2
1.9
44.2
41.2
46.9
GLY-156
GLY-157
13.9
14.0
-3.6
-9.3
69.1
72.6
-2.2

Graph shows rotational transition at bending residues and can be used
to identify hinge bending residues.
Probably only informative for interdomain rotations greater than 20 degrees
Residue
iResidue
i+1Distance of hinge axis to residue i in
(A) Distance of hinge axis to residue i in
(A) Change in
(deg) Change in
(deg) Angle of psi(i) axis to hinge axis
(deg) Angle of psi(i) axis to hinge axis
(deg) Percentage Progress
ARG-161
LYS-162
7.1
7.0
-12.8
8.6
113.4
112.7
87.1
LYS-162
ILE-163
3.4
3.3
18.2
-2.9
113.4
119.0
-90.6
ILE-163
ASN-164
1.0
1.1
2.3
2.8
83.4
85.9
101.6

Graph shows rotational transition at bending residues and can be used
to identify hinge bending residues.
Probably only informative for interdomain rotations greater than 20 degrees