RNA Polymerase II Mediator Complex Subunit 20
(All numbering and residues are taken from first PDB file)
![]()
![]()
Bending Residue Dihedral Analysis
Residue
iResidue
i+1Distance of hinge axis to residue i in
(A) Distance of hinge axis to residue i in
(A) Change in
(deg) Change in
(deg) Angle of psi(i) axis to hinge axis
(deg) Angle of psi(i) axis to hinge axis
(deg) Percentage Progress
LYS-3
SER-4
8.0
7.6
159.6
-11.5
22.3
25.2
1616.9
SER-4
ALA-5
6.1
5.8
-5.2
10.1
92.1
85.2
40.6
ALA-5
VAL-6
5.4
5.6
-7.8
0.2
167.9
165.0
-102.4
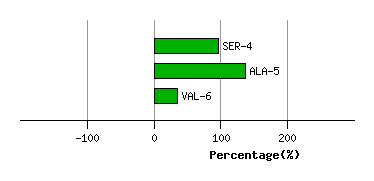
Graph shows rotational transition at bending residues and can be used
to identify hinge bending residues.
Probably only informative for interdomain rotations greater than 20 degrees
Residue
iResidue
i+1Distance of hinge axis to residue i in
(A) Distance of hinge axis to residue i in
(A) Change in
(deg) Change in
(deg) Angle of psi(i) axis to hinge axis
(deg) Angle of psi(i) axis to hinge axis
(deg) Percentage Progress
VAL-9
GLU-10
12.5
12.6
-4.1
15.4
43.6
54.5
-73.1
GLU-10
ARG-11
14.0
14.2
-17.6
2.1
54.1
40.5
119.0
ARG-11
ALA-12
17.2
17.1
19.1
-14.2
115.8
116.1
47.3

Graph shows rotational transition at bending residues and can be used
to identify hinge bending residues.
Probably only informative for interdomain rotations greater than 20 degrees
Residue
iResidue
i+1Distance of hinge axis to residue i in
(A) Distance of hinge axis to residue i in
(A) Change in
(deg) Change in
(deg) Angle of psi(i) axis to hinge axis
(deg) Angle of psi(i) axis to hinge axis
(deg) Percentage Progress
TRP-35
SER-36
7.4
7.3
-0.6
6.6
103.5
111.9
-44.1
SER-36
ILE-37
4.1
4.4
-7.6
-12.3
40.6
41.3
159.8
ILE-37
ASP-38
3.3
3.2
-8.1
12.7
108.9
107.4
23.7

Graph shows rotational transition at bending residues and can be used
to identify hinge bending residues.
Probably only informative for interdomain rotations greater than 20 degrees
Residue
iResidue
i+1Distance of hinge axis to residue i in
(A) Distance of hinge axis to residue i in
(A) Change in
(deg) Change in
(deg) Angle of psi(i) axis to hinge axis
(deg) Angle of psi(i) axis to hinge axis
(deg) Percentage Progress
GLY-124
ASP-125
1.2
1.1
-8.4
11.9
61.6
64.0
-39.2
ASP-125
ALA-126
1.7
1.9
3.4
-12.6
96.9
94.4
-42.6
ALA-126
GLY-127
5.4
5.5
9.3
-3.0
36.8
43.1
92.7
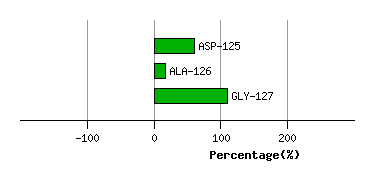
Graph shows rotational transition at bending residues and can be used
to identify hinge bending residues.
Probably only informative for interdomain rotations greater than 20 degrees
Residue
iResidue
i+1Distance of hinge axis to residue i in
(A) Distance of hinge axis to residue i in
(A) Change in
(deg) Change in
(deg) Angle of psi(i) axis to hinge axis
(deg) Angle of psi(i) axis to hinge axis
(deg) Percentage Progress
ILE-153
GLU-154
7.8
7.8
-6.0
11.6
41.1
45.2
-69.2
GLU-154
LEU-155
6.2
6.0
-0.8
-0.4
63.4
61.6
12.4
LEU-155
GLN-156
8.6
8.4
-23.4
18.3
50.4
52.7
60.9

Graph shows rotational transition at bending residues and can be used
to identify hinge bending residues.
Probably only informative for interdomain rotations greater than 20 degrees
Residue
iResidue
i+1Distance of hinge axis to residue i in
(A) Distance of hinge axis to residue i in
(A) Change in
(deg) Change in
(deg) Angle of psi(i) axis to hinge axis
(deg) Angle of psi(i) axis to hinge axis
(deg) Percentage Progress
ASP-158
GLU-159
14.6
13.7
10.3
43.0
9.4
28.9
622.8
GLU-159
ALA-160
14.3
14.8
-28.3
-2.8
103.1
119.9
-166.9
ALA-160
GLY-161
11.1
12.1
18.4
-5.3
59.8
62.5
25.5
GLY-161
GLU-162
13.6
14.7
148.1
136.8
123.1
118.5
470.9
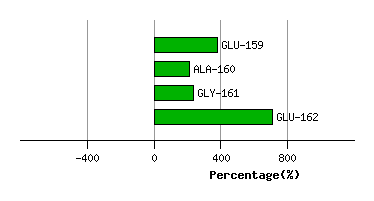
Graph shows rotational transition at bending residues and can be used
to identify hinge bending residues.
Probably only informative for interdomain rotations greater than 20 degrees
Residue
iResidue
i+1Distance of hinge axis to residue i in
(A) Distance of hinge axis to residue i in
(A) Change in
(deg) Change in
(deg) Angle of psi(i) axis to hinge axis
(deg) Angle of psi(i) axis to hinge axis
(deg) Percentage Progress
LYS-183
THR-184
12.3
12.6
1.1
-13.2
104.9
102.8
82.7
THR-184
SER-185
9.9
10.1
-2.4
-1.3
53.5
44.3
-1.3
SER-185
SER-186
6.7
7.0
14.3
-14.0
109.9
104.7
-13.7

Graph shows rotational transition at bending residues and can be used
to identify hinge bending residues.
Probably only informative for interdomain rotations greater than 20 degrees
Residue
iResidue
i+1Distance of hinge axis to residue i in
(A) Distance of hinge axis to residue i in
(A) Change in
(deg) Change in
(deg) Angle of psi(i) axis to hinge axis
(deg) Angle of psi(i) axis to hinge axis
(deg) Percentage Progress
TYR-204
VAL-205
3.5
3.9
0.7
-3.4
88.9
86.4
23.2
VAL-205
ARG-206
7.0
7.3
0.6
3.8
64.5
64.2
37.1
ARG-206
ALA-207
7.8
8.1
5.3
-15.2
123.0
126.0
15.6

Graph shows rotational transition at bending residues and can be used
to identify hinge bending residues.
Probably only informative for interdomain rotations greater than 20 degrees