Hiv-1 Protease (Bru Isolate)
(All numbering and residues are taken from first PDB file)
![]()
![]()
Bending Residue Dihedral Analysis
Residue
iResidue
i+1Distance of hinge axis to residue i in
(A) Distance of hinge axis to residue i in
(A) Change in
(deg) Change in
(deg) Angle of psi(i) axis to hinge axis
(deg) Angle of psi(i) axis to hinge axis
(deg) Percentage Progress
THR-31
VAL-32
4.7
5.0
-6.5
-0.6
82.5
86.6
19.9
VAL-32
LEU-33
2.7
2.6
10.9
-1.8
37.9
33.1
58.7
LEU-33
GLU-34
1.4
1.6
3.1
-2.5
93.5
95.5
18.6
GLU-34
GLU-35
4.9
5.2
9.7
-13.9
122.1
130.0
-35.0
GLU-35
MET-36
7.7
7.8
-1.9
8.0
109.1
109.0
-29.3
MET-36
SER-37
9.0
8.6
-3.3
18.5
24.9
26.4
-83.2
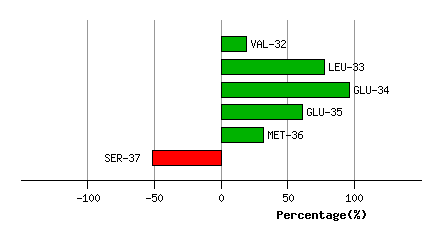
Graph shows rotational transition at bending residues and can be used
to identify hinge bending residues.
Probably only informative for interdomain rotations greater than 20 degrees
Residue
iResidue
i+1Distance of hinge axis to residue i in
(A) Distance of hinge axis to residue i in
(A) Change in
(deg) Change in
(deg) Angle of psi(i) axis to hinge axis
(deg) Angle of psi(i) axis to hinge axis
(deg) Percentage Progress
PRO-39
GLY-40
12.5
12.0
-12.0
0.4
51.2
48.2
26.0
GLY-40
ARG-41
10.3
9.9
-9.3
18.5
38.0
47.3
2.6
ARG-41
TRP-42
8.4
8.3
19.2
-21.6
73.9
72.8
19.7

Graph shows rotational transition at bending residues and can be used
to identify hinge bending residues.
Probably only informative for interdomain rotations greater than 20 degrees
Residue
iResidue
i+1Distance of hinge axis to residue i in
(A) Distance of hinge axis to residue i in
(A) Change in
(deg) Change in
(deg) Angle of psi(i) axis to hinge axis
(deg) Angle of psi(i) axis to hinge axis
(deg) Percentage Progress
GLN-58
TYR-59
1.1
1.0
24.2
-20.6
78.6
79.5
40.4
TYR-59
ASP-60
4.1
3.9
-4.6
12.0
94.3
93.4
15.4
ASP-60
GLN-61
6.1
6.0
-19.9
-5.8
73.9
66.0
120.2

Graph shows rotational transition at bending residues and can be used
to identify hinge bending residues.
Probably only informative for interdomain rotations greater than 20 degrees
Residue
iResidue
i+1Distance of hinge axis to residue i in
(A) Distance of hinge axis to residue i in
(A) Change in
(deg) Change in
(deg) Angle of psi(i) axis to hinge axis
(deg) Angle of psi(i) axis to hinge axis
(deg) Percentage Progress
ALA-71
ILE-72
13.7
13.5
4.5
-21.7
140.8
134.5
135.3
ILE-72
GLY-73
12.4
12.4
-12.3
-8.2
73.0
53.1
29.0
GLY-73
THR-74
9.4
9.5
25.5
1.9
101.8
91.2
-50.4
THR-74
VAL-75
5.9
5.8
3.3
-14.3
33.5
31.9
-84.9

Graph shows rotational transition at bending residues and can be used
to identify hinge bending residues.
Probably only informative for interdomain rotations greater than 20 degrees
Residue
iResidue
i+1Distance of hinge axis to residue i in
(A) Distance of hinge axis to residue i in
(A) Change in
(deg) Change in
(deg) Angle of psi(i) axis to hinge axis
(deg) Angle of psi(i) axis to hinge axis
(deg) Percentage Progress
ASN-83
ILE-84
2.0
1.9
14.8
-15.5
91.0
85.4
-80.6
ILE-84
ILE-85
4.7
4.5
18.2
1.5
61.8
52.1
82.4
ILE-85
GLY-86
6.6
6.6
4.7
7.5
75.8
70.5
37.5

Graph shows rotational transition at bending residues and can be used
to identify hinge bending residues.
Probably only informative for interdomain rotations greater than 20 degrees