Dihydrofolate Reductase (E.C.1.5.1.3)
(All numbering and residues are taken from first PDB file)
![]()
![]()
Bending Residue Dihedral Analysis
Residue
iResidue
i+1Distance of hinge axis to residue i in
(A) Distance of hinge axis to residue i in
(A) Change in
(deg) Change in
(deg) Angle of psi(i) axis to hinge axis
(deg) Angle of psi(i) axis to hinge axis
(deg) Percentage Progress
LYS-38
PRO-39
3.2
3.0
-3.0
5.0
114.9
119.3
-1.7
PRO-39
VAL-40
2.8
2.6
-4.1
-8.2
163.4
161.2
-76.2
VAL-40
ILE-41
4.0
3.8
-12.5
9.1
122.4
120.6
113.7
ILE-41
MET-42
4.7
4.4
-2.4
6.7
146.3
146.1
-40.7
MET-42
GLY-43
6.7
6.7
-4.4
6.1
119.7
123.2
58.9

Graph shows rotational transition at bending residues and can be used
to identify hinge bending residues.
Probably only informative for interdomain rotations greater than 20 degrees
Residue
iResidue
i+1Distance of hinge axis to residue i in
(A) Distance of hinge axis to residue i in
(A) Change in
(deg) Change in
(deg) Angle of psi(i) axis to hinge axis
(deg) Angle of psi(i) axis to hinge axis
(deg) Percentage Progress
PRO-53
LEU-54
14.2
13.9
-2.8
0.3
104.0
91.2
13.1
LEU-54
PRO-55
12.2
12.3
0.4
8.4
7.3
9.2
-51.6
PRO-55
GLY-56
12.8
12.8
-5.5
8.0
115.7
105.5
49.9

Graph shows rotational transition at bending residues and can be used
to identify hinge bending residues.
Probably only informative for interdomain rotations greater than 20 degrees
Residue
iResidue
i+1Distance of hinge axis to residue i in
(A) Distance of hinge axis to residue i in
(A) Change in
(deg) Change in
(deg) Angle of psi(i) axis to hinge axis
(deg) Angle of psi(i) axis to hinge axis
(deg) Percentage Progress
ASN-59
ILE-60
8.8
8.6
5.9
-10.4
75.9
76.6
-57.3
ILE-60
ILE-61
8.7
8.7
11.6
-3.0
16.6
10.7
-6.3
ILE-61
LEU-62
10.7
10.5
13.2
-3.7
66.5
66.0
144.5

Graph shows rotational transition at bending residues and can be used
to identify hinge bending residues.
Probably only informative for interdomain rotations greater than 20 degrees
Residue
iResidue
i+1Distance of hinge axis to residue i in
(A) Distance of hinge axis to residue i in
(A) Change in
(deg) Change in
(deg) Angle of psi(i) axis to hinge axis
(deg) Angle of psi(i) axis to hinge axis
(deg) Percentage Progress
GLY-86
ASP-87
7.1
7.5
31.0
-0.9
97.6
84.1
90.9
ASP-87
VAL-88
7.1
7.1
-17.4
5.0
107.8
93.7
-122.4
VAL-88
PRO-89
4.7
4.6
-4.1
6.1
55.6
56.5
185.3
PRO-89
GLU-90
6.7
6.9
-13.7
11.3
20.6
16.7
-147.0

Graph shows rotational transition at bending residues and can be used
to identify hinge bending residues.
Probably only informative for interdomain rotations greater than 20 degrees
Residue
iResidue
i+1Distance of hinge axis to residue i in
(A) Distance of hinge axis to residue i in
(A) Change in
(deg) Change in
(deg) Angle of psi(i) axis to hinge axis
(deg) Angle of psi(i) axis to hinge axis
(deg) Percentage Progress
MET-92
VAL-93
1.9
1.8
6.6
-1.7
46.4
50.4
11.0
VAL-93
ILE-94
0.9
0.6
-9.0
1.1
122.9
120.5
136.7
ILE-94
GLY-95
4.4
4.2
-8.5
7.0
154.7
151.6
-36.5

Graph shows rotational transition at bending residues and can be used
to identify hinge bending residues.
Probably only informative for interdomain rotations greater than 20 degrees
Residue
iResidue
i+1Distance of hinge axis to residue i in
(A) Distance of hinge axis to residue i in
(A) Change in
(deg) Change in
(deg) Angle of psi(i) axis to hinge axis
(deg) Angle of psi(i) axis to hinge axis
(deg) Percentage Progress
GLY-97
ARG-98
3.4
3.0
-9.0
-8.2
102.4
93.5
-55.7
ARG-98
VAL-99
5.3
5.4
1.5
-4.2
29.6
27.1
29.7
VAL-99
TYR-100
4.6
4.7
1.7
-6.0
91.7
84.8
-192.3
TYR-100
GLU-101
1.5
1.6
-4.4
3.9
68.8
58.3
109.8
GLU-101
GLN-102
4.4
4.2
-0.8
-10.1
126.5
122.4
-217.0
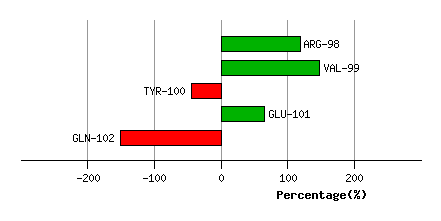
Graph shows rotational transition at bending residues and can be used
to identify hinge bending residues.
Probably only informative for interdomain rotations greater than 20 degrees