Alcohol Dehydrogenase E Chain
(All numbering and residues are taken from first PDB file)
![]()
![]()
Bending Residue Dihedral Analysis
Residue
iResidue
i+1Distance of hinge axis to residue i in
(A) Distance of hinge axis to residue i in
(A) Change in
(deg) Change in
(deg) Angle of psi(i) axis to hinge axis
(deg) Angle of psi(i) axis to hinge axis
(deg) Percentage Progress
PHE-176
SER-177
1.6
1.6
3.3
2.3
20.3
21.9
36.8
SER-177
THR-178
0.5
0.3
1.1
-4.9
45.4
46.8
-30.6
THR-178
GLY-179
2.8
3.0
3.3
-4.0
90.1
89.3
67.9
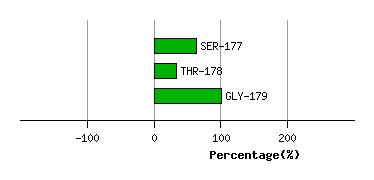
Graph shows rotational transition at bending residues and can be used
to identify hinge bending residues.
Probably only informative for interdomain rotations greater than 20 degrees
Residue
iResidue
i+1Distance of hinge axis to residue i in
(A) Distance of hinge axis to residue i in
(A) Change in
(deg) Change in
(deg) Angle of psi(i) axis to hinge axis
(deg) Angle of psi(i) axis to hinge axis
(deg) Percentage Progress
VAL-290
ILE-291
11.1
11.1
6.6
-5.5
58.0
56.4
22.8
ILE-291
VAL-292
11.8
11.5
-1.2
14.2
118.4
119.1
249.3
VAL-292
GLY-293
9.9
9.2
11.8
-89.5
66.7
78.3
-329.0
GLY-293
VAL-294
12.9
11.4
5.5
-43.1
125.9
116.4
312.0
VAL-294
PRO-295
14.4
14.6
4.1
19.8
94.6
61.7
302.1
PRO-295
PRO-296
17.7
17.3
-21.2
0.3
101.8
43.1
158.0
PRO-296
ASP-297
21.1
18.0
-155.4
-56.4
33.3
65.4
-1524.1
ASP-297
SER-298
21.7
21.6
-104.6
-129.5
39.1
68.1
2035.1
SER-298
GLN-299
22.6
20.9
125.8
16.8
100.3
146.4
-796.2
GLN-299
ASN-300
23.3
23.4
44.9
25.1
122.6
124.1
-496.0
ASN-300
LEU-301
22.5
22.6
5.2
-7.6
69.5
67.2
16.2
LEU-301
SER-302
22.4
22.4
-0.9
-0.7
32.1
34.3
24.5

Graph shows rotational transition at bending residues and can be used
to identify hinge bending residues.
Probably only informative for interdomain rotations greater than 20 degrees
Residue
iResidue
i+1Distance of hinge axis to residue i in
(A) Distance of hinge axis to residue i in
(A) Change in
(deg) Change in
(deg) Angle of psi(i) axis to hinge axis
(deg) Angle of psi(i) axis to hinge axis
(deg) Percentage Progress
GLY-316
ALA-317
8.6
8.2
-1.4
-1.8
97.3
92.8
5.9
ALA-317
ILE-318
5.7
5.2
4.4
-5.2
41.3
42.6
-27.2
ILE-318
PHE-319
5.8
5.4
3.4
-1.1
62.3
61.2
77.3

Graph shows rotational transition at bending residues and can be used
to identify hinge bending residues.
Probably only informative for interdomain rotations greater than 20 degrees
Residue
iResidue
i+1Distance of hinge axis to residue i in
(A) Distance of hinge axis to residue i in
(A) Change in
(deg) Change in
(deg) Angle of psi(i) axis to hinge axis
(deg) Angle of psi(i) axis to hinge axis
(deg) Percentage Progress
PHE-335
MET-336
9.2
9.5
7.9
-14.3
137.9
130.7
47.1
MET-336
ALA-337
11.9
12.6
9.7
2.5
96.2
91.2
-41.8
ALA-337
LYS-338
14.3
14.8
-7.7
-6.9
79.8
65.2
-36.1
LYS-338
LYS-339
12.2
12.9
0.9
9.5
41.9
51.8
43.6
LYS-339
PHE-340
12.1
12.6
-12.0
4.5
91.7
81.2
19.0
PHE-340
ALA-341
8.9
9.6
-4.9
14.3
31.6
36.3
-67.2
ALA-341
LEU-342
6.9
7.4
-1.8
2.0
101.0
104.1
46.2
LEU-342
ASP-343
3.1
3.6
5.7
0.6
143.7
141.3
-53.5

Graph shows rotational transition at bending residues and can be used
to identify hinge bending residues.
Probably only informative for interdomain rotations greater than 20 degrees