Focal Adhesion Kinase 1
(All numbering and residues are taken from first PDB file)
![]()
![]()
Bending Residue Dihedral Analysis
Residue
iResidue
i+1Distance of hinge axis to residue i in
(A) Distance of hinge axis to residue i in
(A) Change in
(deg) Change in
(deg) Angle of psi(i) axis to hinge axis
(deg) Angle of psi(i) axis to hinge axis
(deg) Percentage Progress
TYR-155
MET-156
9.2
9.5
5.7
-3.5
102.0
101.6
6.5
MET-156
LEU-157
11.2
11.6
14.0
-28.5
45.2
46.4
-134.4
LEU-157
GLU-158
12.8
13.3
22.4
25.8
81.0
77.2
108.5

Graph shows rotational transition at bending residues and can be used
to identify hinge bending residues.
Probably only informative for interdomain rotations greater than 20 degrees
Residue
iResidue
i+1Distance of hinge axis to residue i in
(A) Distance of hinge axis to residue i in
(A) Change in
(deg) Change in
(deg) Angle of psi(i) axis to hinge axis
(deg) Angle of psi(i) axis to hinge axis
(deg) Percentage Progress
ILE-167
ALA-168
12.2
12.3
5.0
-2.3
102.8
109.6
-19.9
ALA-168
LEU-169
12.4
12.5
17.4
-9.7
44.6
44.0
54.5
LEU-169
LYS-170
11.4
11.7
-4.3
1.6
92.7
95.4
-38.6
LYS-170
LEU-171
8.2
8.3
3.7
0.4
43.2
41.6
29.0
LYS-170
LEU-171
8.2
8.3
3.7
0.4
43.2
41.6
29.0

Graph shows rotational transition at bending residues and can be used
to identify hinge bending residues.
Probably only informative for interdomain rotations greater than 20 degrees
Residue
iResidue
i+1Distance of hinge axis to residue i in
(A) Distance of hinge axis to residue i in
(A) Change in
(deg) Change in
(deg) Angle of psi(i) axis to hinge axis
(deg) Angle of psi(i) axis to hinge axis
(deg) Percentage Progress
LYS-170
LEU-171
8.2
8.3
3.7
0.4
43.2
41.6
29.0
LYS-170
LEU-171
8.2
8.3
3.7
0.4
43.2
41.6
29.0
LEU-171
GLY-172
7.0
7.2
-1.9
-2.2
84.7
85.5
-3.7
GLY-172
CYS-173
8.8
9.0
14.5
-12.7
133.3
135.2
-27.1
CYS-173
LEU-174
7.1
7.4
-1.4
3.6
107.5
104.4
42.1

Graph shows rotational transition at bending residues and can be used
to identify hinge bending residues.
Probably only informative for interdomain rotations greater than 20 degrees
Residue
iResidue
i+1Distance of hinge axis to residue i in
(A) Distance of hinge axis to residue i in
(A) Change in
(deg) Change in
(deg) Angle of psi(i) axis to hinge axis
(deg) Angle of psi(i) axis to hinge axis
(deg) Percentage Progress
ILE-176
ARG-177
8.1
8.4
-3.1
6.9
60.5
63.8
-24.8
ARG-177
ARG-178
5.7
6.1
-14.5
15.1
125.6
126.4
30.1
ARG-178
SER-179
6.0
6.2
14.2
-11.3
76.5
77.9
-9.4

Graph shows rotational transition at bending residues and can be used
to identify hinge bending residues.
Probably only informative for interdomain rotations greater than 20 degrees
Residue
iResidue
i+1Distance of hinge axis to residue i in
(A) Distance of hinge axis to residue i in
(A) Change in
(deg) Change in
(deg) Angle of psi(i) axis to hinge axis
(deg) Angle of psi(i) axis to hinge axis
(deg) Percentage Progress
GLU-182
MET-183
13.0
13.0
-7.6
15.1
141.8
133.0
105.4
MET-183
ARG-184
11.8
12.2
-154.4
113.5
133.3
137.1
-251.1
ARG-184
GLY-185
10.1
9.5
-60.8
45.5
88.9
118.4
-15.4
GLY-185
ASN-186
6.6
6.8
116.6
-78.5
64.2
23.9
289.2
ASN-186
ALA-187
8.2
8.7
-46.7
-10.6
78.7
83.3
81.7
ALA-187
LEU-188
11.6
12.2
72.8
-62.2
105.8
124.1
-9.0
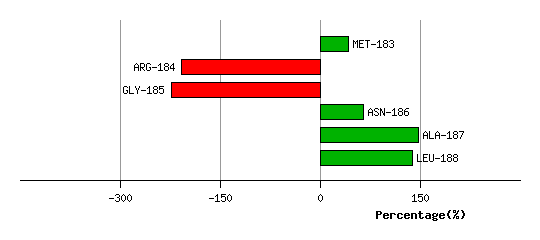
Graph shows rotational transition at bending residues and can be used
to identify hinge bending residues.
Probably only informative for interdomain rotations greater than 20 degrees
Residue
iResidue
i+1Distance of hinge axis to residue i in
(A) Distance of hinge axis to residue i in
(A) Change in
(deg) Change in
(deg) Angle of psi(i) axis to hinge axis
(deg) Angle of psi(i) axis to hinge axis
(deg) Percentage Progress
LYS-190
LYS-191
15.5
15.4
-13.1
5.0
130.6
123.5
-81.0
LYS-191
SER-192
18.5
18.5
32.8
-32.7
50.7
60.6
37.3
SER-192
ASN-193
20.2
19.9
-9.7
8.4
145.2
149.7
3.5

Graph shows rotational transition at bending residues and can be used
to identify hinge bending residues.
Probably only informative for interdomain rotations greater than 20 degrees
Residue
iResidue
i+1Distance of hinge axis to residue i in
(A) Distance of hinge axis to residue i in
(A) Change in
(deg) Change in
(deg) Angle of psi(i) axis to hinge axis
(deg) Angle of psi(i) axis to hinge axis
(deg) Percentage Progress
LEU-223
ILE-224
14.4
14.3
10.3
-0.8
109.5
116.2
-49.8
ILE-224
GLN-225
12.1
12.3
2.7
-2.4
43.2
48.0
0.9
GLN-225
GLN-226
11.0
11.0
-9.4
6.4
110.6
110.9
2.8

Graph shows rotational transition at bending residues and can be used
to identify hinge bending residues.
Probably only informative for interdomain rotations greater than 20 degrees
Residue
iResidue
i+1Distance of hinge axis to residue i in
(A) Distance of hinge axis to residue i in
(A) Change in
(deg) Change in
(deg) Angle of psi(i) axis to hinge axis
(deg) Angle of psi(i) axis to hinge axis
(deg) Percentage Progress
PHE-228
ARG-229
6.4
6.5
4.5
-10.3
129.5
130.1
57.3
ARG-229
GLN-230
4.5
4.5
24.9
-5.3
74.8
77.4
63.7
GLN-230
PHE-231
3.8
3.6
-20.1
0.9
131.4
122.6
-146.8

Graph shows rotational transition at bending residues and can be used
to identify hinge bending residues.
Probably only informative for interdomain rotations greater than 20 degrees
Residue
iResidue
i+1Distance of hinge axis to residue i in
(A) Distance of hinge axis to residue i in
(A) Change in
(deg) Change in
(deg) Angle of psi(i) axis to hinge axis
(deg) Angle of psi(i) axis to hinge axis
(deg) Percentage Progress
ASN-233
LEU-234
3.8
4.0
-18.0
7.6
33.0
26.2
110.5
LEU-234
ASN-235
4.2
4.2
-7.5
2.7
60.8
62.5
5.9
ASN-235
ARG-236
7.0
6.9
4.2
-2.5
154.1
152.8
-10.4

Graph shows rotational transition at bending residues and can be used
to identify hinge bending residues.
Probably only informative for interdomain rotations greater than 20 degrees
Residue
iResidue
i+1Distance of hinge axis to residue i in
(A) Distance of hinge axis to residue i in
(A) Change in
(deg) Change in
(deg) Angle of psi(i) axis to hinge axis
(deg) Angle of psi(i) axis to hinge axis
(deg) Percentage Progress
GLU-238
SER-239
5.5
5.7
14.0
-3.3
81.6
90.1
10.9
SER-239
ILE-240
1.9
2.2
2.1
-13.0
23.4
27.6
-136.1
ILE-240
LEU-241
2.2
2.0
8.3
0.7
84.3
82.1
19.1
LEU-241
LYS-242
5.1
5.0
8.0
-5.0
116.8
117.2
21.4
LYS-242
PHE-243
4.7
4.6
-9.5
6.3
120.7
121.9
-1.2
PHE-243
PHE-244
3.6
3.6
0.6
-1.9
48.0
46.1
32.0

Graph shows rotational transition at bending residues and can be used
to identify hinge bending residues.
Probably only informative for interdomain rotations greater than 20 degrees
Residue
iResidue
i+1Distance of hinge axis to residue i in
(A) Distance of hinge axis to residue i in
(A) Change in
(deg) Change in
(deg) Angle of psi(i) axis to hinge axis
(deg) Angle of psi(i) axis to hinge axis
(deg) Percentage Progress
PHE-253
ASP-254
8.2
8.2
16.0
-23.7
116.0
105.0
22.3
ASP-254
LYS-255
9.5
9.9
13.4
-21.5
152.0
150.4
65.8
LYS-255
GLU-256
11.2
11.3
-3.7
2.5
58.9
58.4
-0.2
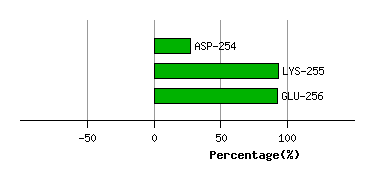
Graph shows rotational transition at bending residues and can be used
to identify hinge bending residues.
Probably only informative for interdomain rotations greater than 20 degrees