Shikimate Kinase
(All numbering and residues are taken from first PDB file)
![]()
![]()
Bending Residue Dihedral Analysis
Residue
iResidue
i+1Distance of hinge axis to residue i in
(A) Distance of hinge axis to residue i in
(A) Change in
(deg) Change in
(deg) Angle of psi(i) axis to hinge axis
(deg) Angle of psi(i) axis to hinge axis
(deg) Percentage Progress
VAL-8
GLY-9
2.6
2.6
-10.3
29.5
97.9
102.6
18.8
GLY-9
LEU-10
4.9
5.3
-4.5
-21.4
66.3
58.0
153.6
LEU-10
PRO-11
8.4
8.7
5.2
-5.6
60.1
51.3
-18.7
PRO-11
GLY-12
11.2
12.1
-5.5
22.3
136.7
122.0
153.1
GLY-12
SER-13
12.4
13.2
-11.1
-7.7
119.3
123.1
-40.5
SER-13
GLY-14
9.3
9.7
1.3
-35.4
30.4
30.5
-279.2
GLY-14
LYS-15
8.9
10.0
2.1
10.0
92.9
93.1
9.3
LYS-15
SER-16
7.3
7.6
-4.4
4.6
123.1
118.4
-68.4

Graph shows rotational transition at bending residues and can be used
to identify hinge bending residues.
Probably only informative for interdomain rotations greater than 20 degrees
Residue
iResidue
i+1Distance of hinge axis to residue i in
(A) Distance of hinge axis to residue i in
(A) Change in
(deg) Change in
(deg) Angle of psi(i) axis to hinge axis
(deg) Angle of psi(i) axis to hinge axis
(deg) Percentage Progress
VAL-98
TYR-99
2.2
2.5
3.5
-7.5
122.3
118.1
-13.0
TYR-99
LEU-100
2.8
2.7
2.6
3.7
51.1
51.6
30.8
LEU-100
GLU-101
4.8
4.7
-18.2
-2.3
54.9
57.3
161.7
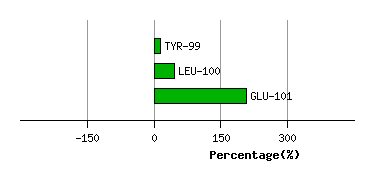
Graph shows rotational transition at bending residues and can be used
to identify hinge bending residues.
Probably only informative for interdomain rotations greater than 20 degrees
Residue
iResidue
i+1Distance of hinge axis to residue i in
(A) Distance of hinge axis to residue i in
(A) Change in
(deg) Change in
(deg) Angle of psi(i) axis to hinge axis
(deg) Angle of psi(i) axis to hinge axis
(deg) Percentage Progress
ARG-109
ARG-110
20.0
20.5
-7.8
-15.1
62.6
61.7
140.6
ARG-110
THR-111
17.2
18.3
-4.9
-15.1
120.2
116.8
-26.4
THR-111
GLY-112
17.9
18.9
-19.4
116.6
102.1
123.3
517.8
GLY-112
GLY-113
21.6
21.9
55.5
164.2
94.1
23.3
-715.7
GLY-113
ASN-114
23.3
20.1
14.4
-4.4
56.7
96.7
102.2
ASN-114
THR-115
21.2
20.8
-23.0
-19.1
164.7
70.8
-271.6
THR-115
VAL-116
22.6
18.2
-25.0
-43.2
112.0
101.9
-690.5
LEU-119
LEU-120
15.7
16.6
-9.8
-23.5
65.5
67.1
103.7
LEU-120
ALA-121
17.7
18.6
97.8
-97.9
89.4
104.5
-156.9
ALA-121
GLY-122
21.2
22.4
8.2
26.0
58.2
42.7
203.7
GLY-122
PRO-123
24.3
25.3
-19.0
17.1
82.5
81.5
-31.4
PRO-123
ASP-124
25.3
26.9
165.1
-166.0
76.1
86.1
-92.2
ASP-124
ARG-125
23.6
23.7
-10.1
0.4
60.7
50.4
58.6
ARG-125
ALA-126
21.0
21.6
3.2
2.5
101.9
112.9
-13.2
ALA-126
GLU-127
20.7
21.4
-11.8
4.7
141.7
131.2
-34.6
GLU-127
LYS-128
20.0
20.3
8.5
-4.8
78.4
80.0
43.9
LYS-128
TYR-129
17.4
17.7
6.7
-4.5
129.7
137.1
5.1
TYR-129
ARG-130
15.7
16.2
2.3
4.1
79.9
84.9
1.1
ARG-130
ALA-131
15.9
16.2
-5.6
2.1
142.9
134.7
-21.5
ALA-131
LEU-132
14.3
14.3
-10.0
12.5
76.2
71.4
-45.2
LEU-132
MET-133
11.3
11.8
-8.2
4.0
62.2
56.4
18.8
MET-133
ALA-134
11.1
11.3
-1.0
1.3
127.5
123.7
52.6
ALA-134
LYS-135
11.7
11.6
4.7
-7.5
59.3
62.3
-47.9
LYS-135
ARG-136
8.6
8.3
4.5
2.5
127.2
130.0
-25.2
ARG-136
ALA-137
6.2
6.2
-15.8
-2.8
50.1
53.4
149.1
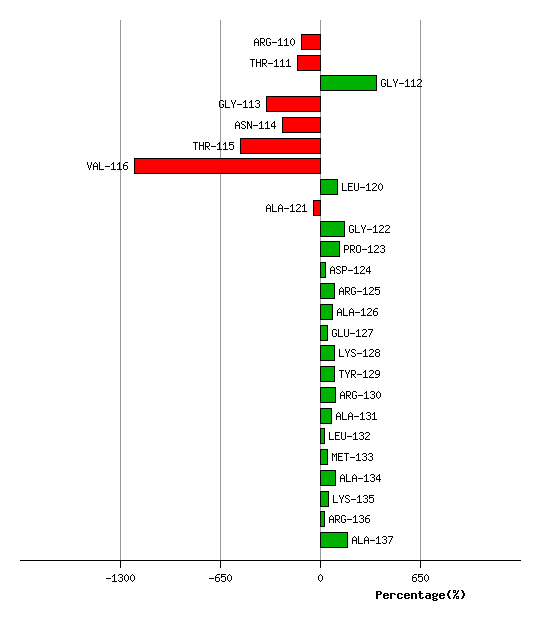
Graph shows rotational transition at bending residues and can be used
to identify hinge bending residues.
Probably only informative for interdomain rotations greater than 20 degrees
Residue
iResidue
i+1Distance of hinge axis to residue i in
(A) Distance of hinge axis to residue i in
(A) Change in
(deg) Change in
(deg) Angle of psi(i) axis to hinge axis
(deg) Angle of psi(i) axis to hinge axis
(deg) Percentage Progress
VAL-143
ALA-144
5.2
5.1
4.9
14.2
11.6
9.8
123.4
ALA-144
THR-145
5.4
5.4
5.6
-11.6
68.4
72.1
-82.4
THR-145
MET-146
8.1
8.1
5.1
4.7
38.5
31.0
72.7
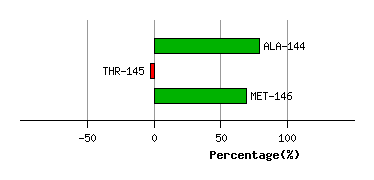
Graph shows rotational transition at bending residues and can be used
to identify hinge bending residues.
Probably only informative for interdomain rotations greater than 20 degrees
Residue
iResidue
i+1Distance of hinge axis to residue i in
(A) Distance of hinge axis to residue i in
(A) Change in
(deg) Change in
(deg) Angle of psi(i) axis to hinge axis
(deg) Angle of psi(i) axis to hinge axis
(deg) Percentage Progress
VAL-158
VAL-159
5.2
4.9
2.3
-6.0
102.4
103.3
18.1
VAL-159
ARG-160
2.3
1.8
6.0
0.3
122.6
124.0
-0.3
ARG-160
HIS-161
2.2
2.4
0.0
1.7
60.0
58.1
-9.1
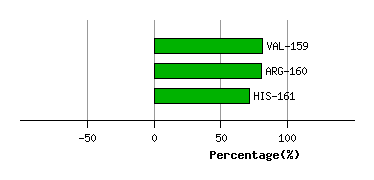
Graph shows rotational transition at bending residues and can be used
to identify hinge bending residues.
Probably only informative for interdomain rotations greater than 20 degrees
Residue
iResidue
i+1Distance of hinge axis to residue i in
(A) Distance of hinge axis to residue i in
(A) Change in
(deg) Change in
(deg) Angle of psi(i) axis to hinge axis
(deg) Angle of psi(i) axis to hinge axis
(deg) Percentage Progress
ILE-162
LEU-163
2.9
3.5
4.0
-14.4
53.4
54.4
-33.7
LEU-163
SER-164
3.7
4.5
5.8
8.5
74.5
74.6
27.5
SER-164
ARG-165
6.3
7.2
0.7
-7.4
134.8
137.5
66.4

Graph shows rotational transition at bending residues and can be used
to identify hinge bending residues.
Probably only informative for interdomain rotations greater than 20 degrees