3-Deoxy-D-Manno-2-Octulosonic Acid Transferase
(All numbering and residues are taken from first PDB file)
![]()
![]()
Bending Residue Dihedral Analysis
Residue
iResidue
i+1Distance of hinge axis to residue i in
(A) Distance of hinge axis to residue i in
(A) Change in
(deg) Change in
(deg) Angle of psi(i) axis to hinge axis
(deg) Angle of psi(i) axis to hinge axis
(deg) Percentage Progress
SER-182
ILE-183
3.6
3.6
-3.9
-7.4
139.5
139.2
-389.8
ILE-183
HIS-184
4.6
4.6
-3.9
4.9
103.8
105.7
-138.3
HIS-184
THR-185
8.0
8.0
-0.5
4.0
178.0
178.5
323.7
THR-185
GLY-186
9.2
9.0
3.7
-2.1
62.0
61.7
-137.8
GLY-186
GLU-187
10.9
10.5
-8.9
14.3
86.6
86.6
-104.4

Graph shows rotational transition at bending residues and can be used
to identify hinge bending residues.
Probably only informative for interdomain rotations greater than 20 degrees
Residue
iResidue
i+1Distance of hinge axis to residue i in
(A) Distance of hinge axis to residue i in
(A) Change in
(deg) Change in
(deg) Angle of psi(i) axis to hinge axis
(deg) Angle of psi(i) axis to hinge axis
(deg) Percentage Progress
ILE-190
ILE-191
8.3
8.5
-0.9
1.7
68.8
71.3
243.9
ILE-191
LEU-192
5.9
6.0
-1.2
-1.6
137.6
138.3
28.9
LEU-192
LYS-193
3.9
4.0
2.5
-2.8
46.9
47.4
7.8

Graph shows rotational transition at bending residues and can be used
to identify hinge bending residues.
Probably only informative for interdomain rotations greater than 20 degrees
Residue
iResidue
i+1Distance of hinge axis to residue i in
(A) Distance of hinge axis to residue i in
(A) Change in
(deg) Change in
(deg) Angle of psi(i) axis to hinge axis
(deg) Angle of psi(i) axis to hinge axis
(deg) Percentage Progress
LEU-205
LYS-206
13.1
13.3
5.4
-3.9
99.7
95.8
207.2
LYS-206
LEU-207
10.5
10.6
6.5
-8.4
52.5
52.4
-19.9
LEU-207
ILE-208
7.0
7.0
-6.5
6.8
113.7
115.4
24.7
ILE-208
LEU-209
6.0
6.2
6.2
-12.2
100.5
100.5
122.9
ILE-208
LEU-209
6.0
6.2
6.2
-12.2
100.5
100.5
122.9
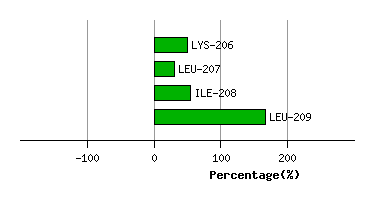
Graph shows rotational transition at bending residues and can be used
to identify hinge bending residues.
Probably only informative for interdomain rotations greater than 20 degrees
Residue
iResidue
i+1Distance of hinge axis to residue i in
(A) Distance of hinge axis to residue i in
(A) Change in
(deg) Change in
(deg) Angle of psi(i) axis to hinge axis
(deg) Angle of psi(i) axis to hinge axis
(deg) Percentage Progress
ILE-208
LEU-209
6.0
6.2
6.2
-12.2
100.5
100.5
122.9
ILE-208
LEU-209
6.0
6.2
6.2
-12.2
100.5
100.5
122.9
LEU-209
VAL-210
2.7
3.0
-3.3
2.9
52.1
56.3
-215.0
VAL-210
PRO-211
3.2
3.4
4.7
-4.6
92.1
91.8
127.8
PRO-211
ARG-212
5.1
5.1
5.3
-7.9
158.3
157.9
259.1
ARG-212
HIS-213
6.7
6.7
-4.0
0.1
82.6
80.0
-255.9
HIS-213
ILE-214
9.6
9.8
12.9
-43.0
52.5
49.3
-1550.8

Graph shows rotational transition at bending residues and can be used
to identify hinge bending residues.
Probably only informative for interdomain rotations greater than 20 degrees
Residue
iResidue
i+1Distance of hinge axis to residue i in
(A) Distance of hinge axis to residue i in
(A) Change in
(deg) Change in
(deg) Angle of psi(i) axis to hinge axis
(deg) Angle of psi(i) axis to hinge axis
(deg) Percentage Progress
ALA-224
ARG-225
2.6
2.7
-1.9
0.5
27.4
26.0
22.7
ARG-225
ASP-226
4.7
4.9
-4.1
1.5
43.4
42.1
167.6
ASP-226
PHE-227
3.2
3.2
-5.5
13.0
85.3
86.2
-134.7
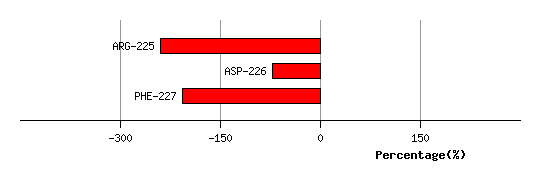
Graph shows rotational transition at bending residues and can be used
to identify hinge bending residues.
Probably only informative for interdomain rotations greater than 20 degrees
Residue
iResidue
i+1Distance of hinge axis to residue i in
(A) Distance of hinge axis to residue i in
(A) Change in
(deg) Change in
(deg) Angle of psi(i) axis to hinge axis
(deg) Angle of psi(i) axis to hinge axis
(deg) Percentage Progress
GLY-306
PHE-307
14.7
14.7
2.5
-1.5
47.8
44.7
-48.4
PHE-307
GLU-308
16.0
16.0
-2.0
0.2
120.0
118.0
-40.1
GLU-308
VAL-309
16.2
16.2
-6.1
5.0
165.1
166.0
120.3
VAL-309
LYS-310
16.0
15.9
1.2
-19.4
67.8
67.8
-640.9
LYS-310
ASN-311
17.3
17.1
1.5
16.2
39.6
27.7
885.4
ASN-311
GLU-312
15.3
15.7
-9.9
1.0
107.1
104.5
-304.4
GLU-312
THR-313
12.9
13.1
10.2
-8.6
81.6
84.5
137.5
THR-313
GLU-314
15.9
16.1
3.5
-1.9
146.7
149.4
-227.8

Graph shows rotational transition at bending residues and can be used
to identify hinge bending residues.
Probably only informative for interdomain rotations greater than 20 degrees
Residue
iResidue
i+1Distance of hinge axis to residue i in
(A) Distance of hinge axis to residue i in
(A) Change in
(deg) Change in
(deg) Angle of psi(i) axis to hinge axis
(deg) Angle of psi(i) axis to hinge axis
(deg) Percentage Progress
LYS-318
LEU-319
16.7
16.8
-2.8
4.5
94.9
92.5
-266.4
LEU-319
THR-320
14.4
14.5
-5.6
-1.1
72.1
71.7
74.4
THR-320
GLU-321
17.5
17.4
3.1
-0.3
46.9
49.1
-136.3

Graph shows rotational transition at bending residues and can be used
to identify hinge bending residues.
Probably only informative for interdomain rotations greater than 20 degrees