Anthranilate Phosphoribosyltransferase
(All numbering and residues are taken from first PDB file)
![]()
![]()
Bending Residue Dihedral Analysis
Residue
iResidue
i+1Distance of hinge axis to residue i in
(A) Distance of hinge axis to residue i in
(A) Change in
(deg) Change in
(deg) Angle of psi(i) axis to hinge axis
(deg) Angle of psi(i) axis to hinge axis
(deg) Percentage Progress
ASP-75
ALA-76
8.4
8.3
-30.6
19.3
90.8
89.1
-59.1
ALA-76
GLN-77
5.0
4.9
-6.3
5.9
103.4
102.3
-58.8
GLN-77
PRO-78
4.9
4.8
2.0
-3.2
148.2
146.2
18.9

Graph shows rotational transition at bending residues and can be used
to identify hinge bending residues.
Probably only informative for interdomain rotations greater than 20 degrees
Residue
iResidue
i+1Distance of hinge axis to residue i in
(A) Distance of hinge axis to residue i in
(A) Change in
(deg) Change in
(deg) Angle of psi(i) axis to hinge axis
(deg) Angle of psi(i) axis to hinge axis
(deg) Percentage Progress
ARG-81
PRO-82
9.8
9.8
-6.8
11.3
133.4
132.0
59.5
PRO-82
ASP-83
11.6
11.9
12.3
-0.6
40.2
37.8
194.8
ASP-83
TYR-84
12.5
12.8
-24.6
17.6
145.6
143.2
-103.5

Graph shows rotational transition at bending residues and can be used
to identify hinge bending residues.
Probably only informative for interdomain rotations greater than 20 degrees
Residue
iResidue
i+1Distance of hinge axis to residue i in
(A) Distance of hinge axis to residue i in
(A) Change in
(deg) Change in
(deg) Angle of psi(i) axis to hinge axis
(deg) Angle of psi(i) axis to hinge axis
(deg) Percentage Progress
ASP-85
PHE-86
8.0
8.3
-7.3
14.9
122.5
117.0
53.5
PHE-86
ALA-87
6.1
6.4
11.2
-1.1
83.3
87.2
-13.5
ALA-87
ASP-88
3.2
3.3
2.0
-0.8
48.4
44.9
15.5
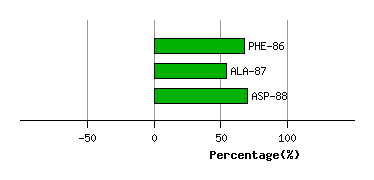
Graph shows rotational transition at bending residues and can be used
to identify hinge bending residues.
Probably only informative for interdomain rotations greater than 20 degrees
Residue
iResidue
i+1Distance of hinge axis to residue i in
(A) Distance of hinge axis to residue i in
(A) Change in
(deg) Change in
(deg) Angle of psi(i) axis to hinge axis
(deg) Angle of psi(i) axis to hinge axis
(deg) Percentage Progress
GLY-114
ALA-115
13.7
13.4
-29.6
6.4
65.7
50.7
156.6
ALA-115
LYS-116
10.2
10.1
-4.7
2.1
9.9
12.9
13.3
LYS-116
VAL-117
9.4
9.8
-2.9
4.8
64.2
65.0
-13.8

Graph shows rotational transition at bending residues and can be used
to identify hinge bending residues.
Probably only informative for interdomain rotations greater than 20 degrees
Residue
iResidue
i+1Distance of hinge axis to residue i in
(A) Distance of hinge axis to residue i in
(A) Change in
(deg) Change in
(deg) Angle of psi(i) axis to hinge axis
(deg) Angle of psi(i) axis to hinge axis
(deg) Percentage Progress
LYS-119
HIS-120
6.7
6.5
2.6
9.5
22.7
21.0
209.5
HIS-120
GLY-121
5.3
5.1
15.8
-56.0
80.3
80.6
-176.6
GLY-121
ASN-122
8.1
7.8
-2.0
-17.5
166.1
151.2
-302.8
ASN-122
ARG-123
9.2
9.7
-25.1
29.8
105.1
94.1
140.9
ARG-123
SER-124
12.3
13.4
5.8
9.7
116.6
88.9
-8.7
ALA-130
GLY-131
19.8
21.6
155.3
177.3
114.3
115.1
192.9
GLY-131
SER-132
16.1
19.2
48.8
-58.4
99.2
113.8
66.3
SER-132
CYS-133
14.0
16.1
-135.9
122.6
143.9
135.2
-196.8
CYS-133
ASP-134
13.1
14.1
23.0
-18.3
66.3
46.3
37.8
ASP-134
LEU-135
16.7
17.3
10.5
-8.5
120.1
112.8
23.4
LEU-135
LEU-136
18.2
19.3
26.0
-13.9
85.2
96.0
-2.5

Graph shows rotational transition at bending residues and can be used
to identify hinge bending residues.
Probably only informative for interdomain rotations greater than 20 degrees
Residue
iResidue
i+1Distance of hinge axis to residue i in
(A) Distance of hinge axis to residue i in
(A) Change in
(deg) Change in
(deg) Angle of psi(i) axis to hinge axis
(deg) Angle of psi(i) axis to hinge axis
(deg) Percentage Progress
CYS-160
PHE-161
10.6
10.8
-4.9
9.5
74.3
75.0
-8.4
PHE-161
LEU-162
9.0
9.2
-8.4
7.7
39.8
41.2
25.8
LEU-162
PHE-163
5.9
5.9
-17.9
14.2
63.7
64.1
18.0
PHE-163
ALA-164
6.4
6.6
-6.8
4.6
69.6
67.9
49.9
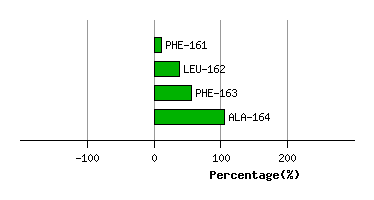
Graph shows rotational transition at bending residues and can be used
to identify hinge bending residues.
Probably only informative for interdomain rotations greater than 20 degrees
Residue
iResidue
i+1Distance of hinge axis to residue i in
(A) Distance of hinge axis to residue i in
(A) Change in
(deg) Change in
(deg) Angle of psi(i) axis to hinge axis
(deg) Angle of psi(i) axis to hinge axis
(deg) Percentage Progress
TYR-167
HIS-168
0.5
0.5
-7.1
3.3
80.2
78.9
-18.4
HIS-168
THR-169
3.3
3.3
-9.0
8.0
24.0
24.3
19.0
THR-169
GLY-170
3.4
3.3
-14.4
0.0
73.8
76.5
79.3
GLY-170
PHE-171
7.1
7.0
-0.8
1.9
102.7
114.8
-20.5
PHE-171
ARG-172
8.5
8.3
3.2
-18.2
143.1
129.6
152.9
ARG-172
HIS-173
9.0
9.4
4.4
13.1
106.0
115.7
-151.6

Graph shows rotational transition at bending residues and can be used
to identify hinge bending residues.
Probably only informative for interdomain rotations greater than 20 degrees
Residue
iResidue
i+1Distance of hinge axis to residue i in
(A) Distance of hinge axis to residue i in
(A) Change in
(deg) Change in
(deg) Angle of psi(i) axis to hinge axis
(deg) Angle of psi(i) axis to hinge axis
(deg) Percentage Progress
VAL-189
LEU-190
13.7
13.7
7.8
-5.8
75.0
76.6
13.4
LEU-190
GLY-191
11.3
11.2
23.8
-15.6
84.4
78.7
46.9
GLY-191
PRO-192
9.2
9.3
8.1
-8.5
136.7
132.9
14.3
PRO-192
LEU-193
7.7
7.6
-10.2
10.7
78.0
78.5
-30.0
LEU-193
ILE-194
7.0
7.1
20.8
-20.0
47.0
45.8
16.1

Graph shows rotational transition at bending residues and can be used
to identify hinge bending residues.
Probably only informative for interdomain rotations greater than 20 degrees
Residue
iResidue
i+1Distance of hinge axis to residue i in
(A) Distance of hinge axis to residue i in
(A) Change in
(deg) Change in
(deg) Angle of psi(i) axis to hinge axis
(deg) Angle of psi(i) axis to hinge axis
(deg) Percentage Progress
ARG-198
PRO-199
4.3
4.7
-0.4
-3.3
25.7
24.2
71.1
PRO-199
PRO-200
3.4
3.4
-9.0
-1.8
42.3
42.6
126.2
PRO-200
LYS-201
4.7
4.7
-0.3
2.3
53.9
51.4
-17.9
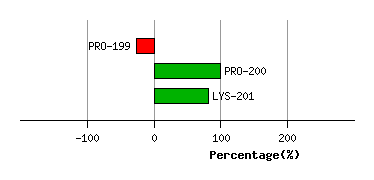
Graph shows rotational transition at bending residues and can be used
to identify hinge bending residues.
Probably only informative for interdomain rotations greater than 20 degrees