Metabotropic Glutamate Receptor Subtype 1
(All numbering and residues are taken from first PDB file)
![]()
![]()
Bending Residue Dihedral Analysis
Residue
iResidue
i+1Distance of hinge axis to residue i in
(A) Distance of hinge axis to residue i in
(A) Change in
(deg) Change in
(deg) Angle of psi(i) axis to hinge axis
(deg) Angle of psi(i) axis to hinge axis
(deg) Percentage Progress
ASP-208
THR-209
5.7
6.2
36.5
-24.0
83.7
85.0
13.1
THR-209
LEU-210
4.0
3.9
8.2
0.2
66.9
59.6
0.1
LEU-210
GLN-211
1.0
1.4
26.6
-9.2
18.4
12.6
220.5
GLN-211
ALA-212
3.1
3.2
-5.4
15.2
126.4
110.8
19.5
ALA-212
ARG-213
3.5
3.9
-3.6
-14.2
93.3
97.6
14.4
ARG-213
ALA-214
2.7
2.6
-18.1
17.0
141.1
146.1
-14.6

Graph shows rotational transition at bending residues and can be used
to identify hinge bending residues.
Probably only informative for interdomain rotations greater than 20 degrees
Residue
iResidue
i+1Distance of hinge axis to residue i in
(A) Distance of hinge axis to residue i in
(A) Change in
(deg) Change in
(deg) Angle of psi(i) axis to hinge axis
(deg) Angle of psi(i) axis to hinge axis
(deg) Percentage Progress
HIS-231
THR-232
14.3
14.4
15.8
-22.9
80.3
85.3
33.8
THR-232
GLU-233
16.7
16.9
13.0
1.5
31.6
25.9
125.4
GLU-233
GLY-234
19.4
19.4
12.0
3.8
42.4
48.9
79.6
GLY-234
ASN-235
19.1
18.7
-33.4
17.3
67.2
63.6
129.1
GLY-234
ASN-235
19.1
18.7
-33.4
17.3
67.2
63.6
129.1

Graph shows rotational transition at bending residues and can be used
to identify hinge bending residues.
Probably only informative for interdomain rotations greater than 20 degrees
Residue
iResidue
i+1Distance of hinge axis to residue i in
(A) Distance of hinge axis to residue i in
(A) Change in
(deg) Change in
(deg) Angle of psi(i) axis to hinge axis
(deg) Angle of psi(i) axis to hinge axis
(deg) Percentage Progress
GLY-234
ASN-235
19.1
18.7
-33.4
17.3
67.2
63.6
129.1
GLY-234
ASN-235
19.1
18.7
-33.4
17.3
67.2
63.6
129.1
ASN-235
TYR-236
16.5
15.8
3.4
6.2
64.6
57.7
6.2
TYR-236
GLY-237
13.9
13.5
-11.2
13.2
117.0
126.6
27.2
GLY-237
GLU-238
13.2
13.6
9.1
-15.6
124.2
114.0
67.0
GLU-238
SER-239
14.7
14.6
-11.0
7.1
44.4
54.1
-13.6
SER-239
GLY-240
12.1
11.8
5.9
6.6
68.9
57.0
63.5
GLY-240
MET-241
9.0
9.2
-2.6
-9.6
114.4
119.1
-72.3

Graph shows rotational transition at bending residues and can be used
to identify hinge bending residues.
Probably only informative for interdomain rotations greater than 20 degrees
Residue
iResidue
i+1Distance of hinge axis to residue i in
(A) Distance of hinge axis to residue i in
(A) Change in
(deg) Change in
(deg) Angle of psi(i) axis to hinge axis
(deg) Angle of psi(i) axis to hinge axis
(deg) Percentage Progress
GLY-316
SER-317
7.4
7.2
24.5
-8.8
39.3
38.0
93.6
SER-317
ASP-318
7.4
7.5
4.1
-11.1
90.5
98.2
12.1
ASP-318
GLY-319
9.8
9.9
7.6
-6.9
94.3
96.8
40.3
GLY-319
TRP-320
12.5
12.8
25.6
-26.5
155.7
161.6
3.1
TRP-320
ALA-321
12.3
12.1
-0.7
-16.6
91.2
87.4
-29.3

Graph shows rotational transition at bending residues and can be used
to identify hinge bending residues.
Probably only informative for interdomain rotations greater than 20 degrees
Residue
iResidue
i+1Distance of hinge axis to residue i in
(A) Distance of hinge axis to residue i in
(A) Change in
(deg) Change in
(deg) Angle of psi(i) axis to hinge axis
(deg) Angle of psi(i) axis to hinge axis
(deg) Percentage Progress
ILE-340
LYS-341
6.3
6.4
38.3
-41.3
72.0
70.4
50.9
LYS-341
LEU-342
9.8
9.6
29.8
-9.2
29.9
37.3
172.0
LEU-342
GLN-343
10.3
10.8
13.6
5.1
92.3
106.3
-76.4
GLN-343
SER-344
12.9
13.2
42.0
-24.1
41.5
60.8
72.2
SER-344
PRO-345
15.9
16.7
-24.2
14.8
64.3
80.0
68.6
PRO-345
GLU-346
18.9
19.3
-44.1
29.2
113.0
103.5
-61.8
GLU-346
VAL-347
22.4
22.8
-18.4
13.8
135.6
137.8
-4.2

Graph shows rotational transition at bending residues and can be used
to identify hinge bending residues.
Probably only informative for interdomain rotations greater than 20 degrees
Residue
iResidue
i+1Distance of hinge axis to residue i in
(A) Distance of hinge axis to residue i in
(A) Change in
(deg) Change in
(deg) Angle of psi(i) axis to hinge axis
(deg) Angle of psi(i) axis to hinge axis
(deg) Percentage Progress
GLY-477
ARG-478
7.4
7.2
-2.6
2.4
134.8
142.4
-26.4
ARG-478
TYR-479
9.4
9.4
-7.5
8.5
143.3
135.4
69.6
TYR-479
ASP-480
8.1
8.4
17.2
-3.2
25.1
27.6
87.0

Graph shows rotational transition at bending residues and can be used
to identify hinge bending residues.
Probably only informative for interdomain rotations greater than 20 degrees
Residue
iResidue
i+1Distance of hinge axis to residue i in
(A) Distance of hinge axis to residue i in
(A) Change in
(deg) Change in
(deg) Angle of psi(i) axis to hinge axis
(deg) Angle of psi(i) axis to hinge axis
(deg) Percentage Progress
GLY-498
THR-499
9.4
9.6
18.0
-3.5
26.2
28.0
124.5
THR-499
TRP-500
9.2
9.3
7.2
-2.6
47.7
56.7
-54.3
TRP-500
HIS-501
7.3
7.3
5.2
7.3
35.8
37.1
70.3
HIS-501
GLU-502
9.8
10.0
8.7
-10.0
32.6
35.2
7.1
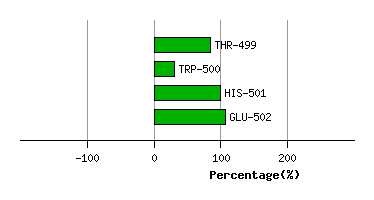
Graph shows rotational transition at bending residues and can be used
to identify hinge bending residues.
Probably only informative for interdomain rotations greater than 20 degrees