Autoinducer 2-Binding Periplasmic Protein Luxp
(All numbering and residues are taken from first PDB file)
![]()
![]()
Bending Residue Dihedral Analysis
Residue
iResidue
i+1Distance of hinge axis to residue i in
(A) Distance of hinge axis to residue i in
(A) Change in
(deg) Change in
(deg) Angle of psi(i) axis to hinge axis
(deg) Angle of psi(i) axis to hinge axis
(deg) Percentage Progress
GLY-177
PHE-178
4.6
3.9
-8.9
4.2
106.9
113.5
-2.5
PHE-178
ASP-179
2.2
1.6
-2.1
-22.2
43.2
44.1
51.6
ASP-179
HIS-180
2.8
2.5
9.2
-0.1
82.5
79.9
7.9
HIS-180
ALA-181
6.6
6.3
-0.1
-4.9
73.6
75.8
3.2
ALA-181
GLU-182
7.7
7.6
3.1
5.2
47.5
51.6
18.8

Graph shows rotational transition at bending residues and can be used
to identify hinge bending residues.
Probably only informative for interdomain rotations greater than 20 degrees
Residue
iResidue
i+1Distance of hinge axis to residue i in
(A) Distance of hinge axis to residue i in
(A) Change in
(deg) Change in
(deg) Angle of psi(i) axis to hinge axis
(deg) Angle of psi(i) axis to hinge axis
(deg) Percentage Progress
VAL-308
MET-309
9.4
9.2
6.3
-9.4
112.0
107.4
3.4
MET-309
ARG-310
6.4
6.1
3.7
16.0
66.5
65.7
5.3
ARG-310
MET-311
3.2
2.8
-12.0
-6.8
43.8
41.0
48.2
MET-311
ASN-312
0.1
0.8
10.4
-14.5
77.0
73.7
27.7
ASN-312
ASP-313
3.8
3.5
10.3
-4.3
82.7
81.2
5.4

Graph shows rotational transition at bending residues and can be used
to identify hinge bending residues.
Probably only informative for interdomain rotations greater than 20 degrees
Residue
iResidue
i+1Distance of hinge axis to residue i in
(A) Distance of hinge axis to residue i in
(A) Change in
(deg) Change in
(deg) Angle of psi(i) axis to hinge axis
(deg) Angle of psi(i) axis to hinge axis
(deg) Percentage Progress
VAL-335
TYR-336
6.8
7.0
-5.5
1.6
149.5
149.9
-5.1
TYR-336
SER-337
5.9
6.2
2.5
11.1
64.4
66.1
24.3
SER-337
GLY-338
2.7
3.1
-1.2
16.1
153.9
160.2
53.0
GLY-338
ASP-339
2.5
3.1
-12.8
29.2
94.8
105.4
18.4
ASP-339
PHE-340
3.5
4.4
-20.1
6.0
124.8
108.7
-14.0
PHE-340
GLU-341
4.9
5.1
-15.0
11.5
129.6
130.0
-12.5
GLU-341
ILE-342
7.4
7.6
2.8
8.0
85.3
83.9
26.8
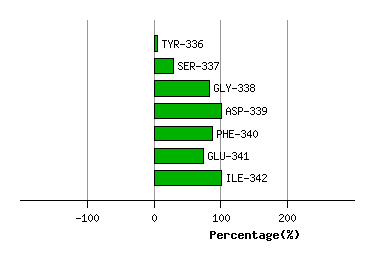
Graph shows rotational transition at bending residues and can be used
to identify hinge bending residues.
Probably only informative for interdomain rotations greater than 20 degrees
Residue
iResidue
i+1Distance of hinge axis to residue i in
(A) Distance of hinge axis to residue i in
(A) Change in
(deg) Change in
(deg) Angle of psi(i) axis to hinge axis
(deg) Angle of psi(i) axis to hinge axis
(deg) Percentage Progress
ALA-354
LEU-355
4.4
4.8
0.9
2.6
24.4
18.0
7.2
LEU-355
LYS-356
3.5
4.1
-1.3
3.5
88.6
92.6
4.1
LYS-356
LYS-357
1.9
1.5
-9.8
-1.8
80.3
80.6
-0.2
LYS-357
ARG-358
1.7
2.0
1.4
8.7
32.4
38.8
23.5
ARG-358
ALA-359
2.9
3.8
2.3
5.8
52.0
45.0
30.4

Graph shows rotational transition at bending residues and can be used
to identify hinge bending residues.
Probably only informative for interdomain rotations greater than 20 degrees