Glutamate Receptor, Ionotropic Kainate 2
(All numbering and residues are taken from first PDB file)
![]()
![]()
Bending Residue Dihedral Analysis
Residue
iResidue
i+1Distance of hinge axis to residue i in
(A) Distance of hinge axis to residue i in
(A) Change in
(deg) Change in
(deg) Angle of psi(i) axis to hinge axis
(deg) Angle of psi(i) axis to hinge axis
(deg) Percentage Progress
PHE-106
MET-107
10.3
10.2
3.5
-1.5
115.6
118.7
-1.0
MET-107
THR-108
6.8
6.6
3.1
8.8
38.7
45.3
48.4
THR-108
LEU-109
4.9
4.0
21.4
-7.7
112.8
118.0
-22.2
LEU-109
GLY-110
2.3
0.9
-22.3
25.8
134.4
137.3
20.3
GLY-110
ILE-111
3.4
3.4
-8.8
4.0
62.4
66.8
2.7
ILE-111
SER-112
6.4
6.7
-14.2
8.6
66.0
67.7
17.1
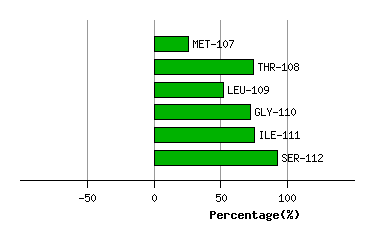
Graph shows rotational transition at bending residues and can be used
to identify hinge bending residues.
Probably only informative for interdomain rotations greater than 20 degrees
Residue
iResidue
i+1Distance of hinge axis to residue i in
(A) Distance of hinge axis to residue i in
(A) Change in
(deg) Change in
(deg) Angle of psi(i) axis to hinge axis
(deg) Angle of psi(i) axis to hinge axis
(deg) Percentage Progress
LEU-211
ILE-212
8.2
8.2
4.3
-8.9
152.1
152.9
63.7
ILE-212
ASP-213
8.9
8.9
25.5
-17.7
138.7
130.3
-33.0
ASP-213
SER-214
5.6
5.4
-13.8
1.1
113.2
119.6
-19.2
SER-214
LYS-215
3.0
2.7
-10.1
13.8
79.2
73.0
43.5
LYS-215
GLY-216
1.4
1.2
14.9
-7.5
41.2
49.0
25.5
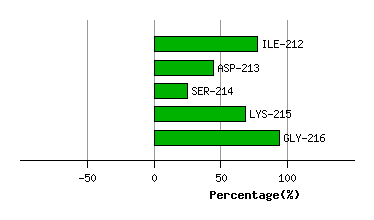
Graph shows rotational transition at bending residues and can be used
to identify hinge bending residues.
Probably only informative for interdomain rotations greater than 20 degrees