Protein Phosphatase Pp2a
(All numbering and residues are taken from first PDB file)
![]()
![]()
Bending Residue Dihedral Analysis
Residue
iResidue
i+1Distance of hinge axis to residue i in
(A) Distance of hinge axis to residue i in
(A) Change in
(deg) Change in
(deg) Angle of psi(i) axis to hinge axis
(deg) Angle of psi(i) axis to hinge axis
(deg) Percentage Progress
SER-347
VAL-348
13.6
13.5
-66.8
61.1
95.7
80.0
123.9
VAL-348
ILE-349
16.8
16.7
-9.1
1.7
67.1
54.3
42.1
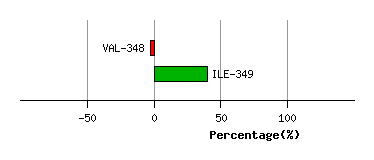
Graph shows rotational transition at bending residues and can be used
to identify hinge bending residues.
Probably only informative for interdomain rotations greater than 20 degrees
Residue
iResidue
i+1Distance of hinge axis to residue i in
(A) Distance of hinge axis to residue i in
(A) Change in
(deg) Change in
(deg) Angle of psi(i) axis to hinge axis
(deg) Angle of psi(i) axis to hinge axis
(deg) Percentage Progress
LEU-352
SER-353
22.6
21.8
-2.6
-2.8
154.0
146.2
-53.1
SER-353
PRO-354
23.1
22.7
7.8
-7.9
78.4
81.9
78.1
PRO-354
ILE-355
26.4
26.1
-9.0
14.1
55.2
49.2
8.5

Graph shows rotational transition at bending residues and can be used
to identify hinge bending residues.
Probably only informative for interdomain rotations greater than 20 degrees
Residue
iResidue
i+1Distance of hinge axis to residue i in
(A) Distance of hinge axis to residue i in
(A) Change in
(deg) Change in
(deg) Angle of psi(i) axis to hinge axis
(deg) Angle of psi(i) axis to hinge axis
(deg) Percentage Progress
THR-361
ILE-362
22.9
22.4
-8.0
15.5
56.3
49.0
-51.0
ILE-362
GLU-363
21.8
21.7
-5.0
-6.4
106.1
107.7
38.3
GLU-363
HIS-364
23.3
23.0
3.1
-17.5
34.0
39.0
-106.8

Graph shows rotational transition at bending residues and can be used
to identify hinge bending residues.
Probably only informative for interdomain rotations greater than 20 degrees
Residue
iResidue
i+1Distance of hinge axis to residue i in
(A) Distance of hinge axis to residue i in
(A) Change in
(deg) Change in
(deg) Angle of psi(i) axis to hinge axis
(deg) Angle of psi(i) axis to hinge axis
(deg) Percentage Progress
LEU-366
PRO-367
17.4
17.0
19.0
-25.8
97.9
90.9
109.7
PRO-367
LEU-368
15.9
15.5
25.3
-7.6
132.8
145.3
-76.8
LEU-368
PHE-369
14.3
14.4
-10.8
0.8
109.7
106.0
8.7

Graph shows rotational transition at bending residues and can be used
to identify hinge bending residues.
Probably only informative for interdomain rotations greater than 20 degrees
Residue
iResidue
i+1Distance of hinge axis to residue i in
(A) Distance of hinge axis to residue i in
(A) Change in
(deg) Change in
(deg) Angle of psi(i) axis to hinge axis
(deg) Angle of psi(i) axis to hinge axis
(deg) Percentage Progress
LYS-374
ASP-375
5.2
5.1
11.3
-0.2
36.1
34.4
175.9
ASP-375
GLU-376
4.3
4.0
-5.9
5.0
89.3
88.8
-84.9
GLU-376
CYS-377
2.0
2.2
-13.3
8.5
114.8
115.1
-20.3
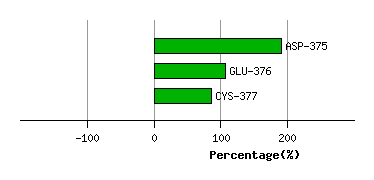
Graph shows rotational transition at bending residues and can be used
to identify hinge bending residues.
Probably only informative for interdomain rotations greater than 20 degrees
Residue
iResidue
i+1Distance of hinge axis to residue i in
(A) Distance of hinge axis to residue i in
(A) Change in
(deg) Change in
(deg) Angle of psi(i) axis to hinge axis
(deg) Angle of psi(i) axis to hinge axis
(deg) Percentage Progress
GLU-379
VAL-380
6.3
6.1
19.2
-19.1
67.4
72.3
49.8
VAL-380
ARG-381
6.2
5.9
-12.3
2.9
163.3
155.7
-54.9
ARG-381
LEU-382
6.3
6.1
18.0
-16.3
83.9
78.8
120.9

Graph shows rotational transition at bending residues and can be used
to identify hinge bending residues.
Probably only informative for interdomain rotations greater than 20 degrees
Residue
iResidue
i+1Distance of hinge axis to residue i in
(A) Distance of hinge axis to residue i in
(A) Change in
(deg) Change in
(deg) Angle of psi(i) axis to hinge axis
(deg) Angle of psi(i) axis to hinge axis
(deg) Percentage Progress
ASP-389
CYS-390
19.6
20.0
-19.5
47.1
89.3
112.9
120.1
CYS-390
VAL-391
21.5
21.3
46.7
-93.9
121.0
115.9
356.7
VAL-391
ASN-392
20.2
20.1
21.9
-8.1
141.3
155.4
-158.1

Graph shows rotational transition at bending residues and can be used
to identify hinge bending residues.
Probably only informative for interdomain rotations greater than 20 degrees