Glyceraldehyde-3-Phosphate Dehydrogenase
(All numbering and residues are taken from first PDB file)
![]()
![]()
Bending Residue Dihedral Analysis
Residue
iResidue
i+1Distance of hinge axis to residue i in
(A) Distance of hinge axis to residue i in
(A) Change in
(deg) Change in
(deg) Angle of psi(i) axis to hinge axis
(deg) Angle of psi(i) axis to hinge axis
(deg) Percentage Progress
ILE-11
GLY-12
9.5
9.4
4.3
-5.9
52.9
56.3
-32.0
GLY-12
ARG-13
10.6
10.4
2.1
2.6
53.9
53.7
36.8
ARG-13
ILE-14
7.7
7.5
-2.7
3.1
63.0
61.3
12.7
ILE-14
VAL-15
4.9
4.8
-0.1
5.7
68.6
69.6
65.4
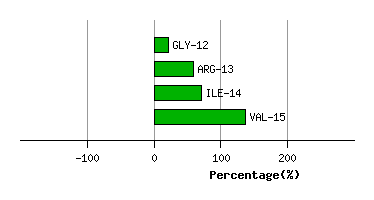
Graph shows rotational transition at bending residues and can be used
to identify hinge bending residues.
Probably only informative for interdomain rotations greater than 20 degrees
Residue
iResidue
i+1Distance of hinge axis to residue i in
(A) Distance of hinge axis to residue i in
(A) Change in
(deg) Change in
(deg) Angle of psi(i) axis to hinge axis
(deg) Angle of psi(i) axis to hinge axis
(deg) Percentage Progress
ASP-38
TYR-39
10.9
11.3
-18.3
6.7
49.5
46.9
130.9
TYR-39
MET-40
11.9
12.2
1.6
-6.3
144.9
143.3
125.5
MET-40
ALA-41
10.8
10.9
-1.5
6.7
95.6
98.7
-67.7
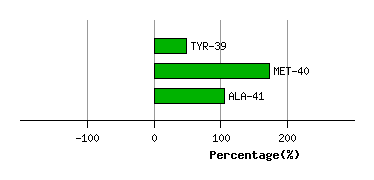
Graph shows rotational transition at bending residues and can be used
to identify hinge bending residues.
Probably only informative for interdomain rotations greater than 20 degrees
Residue
iResidue
i+1Distance of hinge axis to residue i in
(A) Distance of hinge axis to residue i in
(A) Change in
(deg) Change in
(deg) Angle of psi(i) axis to hinge axis
(deg) Angle of psi(i) axis to hinge axis
(deg) Percentage Progress
MET-43
LEU-44
8.6
8.4
2.9
4.8
60.1
61.7
162.5
LEU-44
LYS-45
5.4
5.4
-5.0
0.2
70.9
73.0
51.9
LYS-45
TYR-46
3.2
3.2
0.4
-3.1
66.1
67.5
-9.5
TYR-46
ASP-47
6.0
6.0
1.0
-8.9
28.8
28.8
-239.5

Graph shows rotational transition at bending residues and can be used
to identify hinge bending residues.
Probably only informative for interdomain rotations greater than 20 degrees
Residue
iResidue
i+1Distance of hinge axis to residue i in
(A) Distance of hinge axis to residue i in
(A) Change in
(deg) Change in
(deg) Angle of psi(i) axis to hinge axis
(deg) Angle of psi(i) axis to hinge axis
(deg) Percentage Progress
HIS-50
GLY-51
6.2
5.7
-7.8
-3.5
35.4
34.9
240.4
GLY-51
ARG-52
6.9
6.6
5.7
-2.8
127.4
129.7
-31.3
ARG-52
PHE-53
4.7
4.5
0.1
-6.3
70.3
72.0
12.6

Graph shows rotational transition at bending residues and can be used
to identify hinge bending residues.
Probably only informative for interdomain rotations greater than 20 degrees
Residue
iResidue
i+1Distance of hinge axis to residue i in
(A) Distance of hinge axis to residue i in
(A) Change in
(deg) Change in
(deg) Angle of psi(i) axis to hinge axis
(deg) Angle of psi(i) axis to hinge axis
(deg) Percentage Progress
SER-148
CYS-149
11.4
11.3
2.9
-2.8
93.2
93.9
65.4
CYS-149
THR-150
8.4
8.3
-4.7
3.9
29.6
30.2
-5.4
THR-150
THR-151
9.4
9.3
9.5
-7.4
137.0
139.2
-6.4

Graph shows rotational transition at bending residues and can be used
to identify hinge bending residues.
Probably only informative for interdomain rotations greater than 20 degrees
Residue
iResidue
i+1Distance of hinge axis to residue i in
(A) Distance of hinge axis to residue i in
(A) Change in
(deg) Change in
(deg) Angle of psi(i) axis to hinge axis
(deg) Angle of psi(i) axis to hinge axis
(deg) Percentage Progress
SER-207
THR-208
21.0
21.1
13.6
-15.3
106.7
108.7
-38.2
THR-208
GLY-209
17.7
17.9
-1.9
0.7
138.4
135.0
-29.7
GLY-209
ALA-210
17.3
17.2
-23.8
22.2
97.1
96.9
-77.2
ALA-210
ALA-211
13.5
13.5
-3.5
-0.9
160.4
159.0
-79.6
ALA-211
LYS-212
13.1
12.9
2.9
-5.1
60.7
56.3
-4.5
LYS-212
ALA-213
15.5
15.3
10.5
-5.3
110.5
109.7
-12.0
ALA-213
VAL-214
14.6
14.6
6.5
4.8
69.5
68.0
120.3
VAL-214
GLY-215
11.2
11.3
-6.9
14.7
147.4
137.9
154.5
GLY-215
LYS-216
13.1
13.6
-13.7
14.0
76.5
72.9
-76.8
LYS-216
VAL-217
15.0
15.3
-5.1
0.0
73.4
80.1
-15.4
VAL-217
LEU-218
12.4
12.6
2.8
-6.1
39.5
34.5
-62.7
LEU-218
PRO-219
10.7
11.0
7.8
-13.3
40.5
46.2
-44.9
PRO-219
GLU-220
13.6
13.9
2.8
-4.4
30.1
32.5
-103.2
GLU-220
LEU-221
11.3
11.5
3.8
-7.2
90.4
93.5
79.1

Graph shows rotational transition at bending residues and can be used
to identify hinge bending residues.
Probably only informative for interdomain rotations greater than 20 degrees
Residue
iResidue
i+1Distance of hinge axis to residue i in
(A) Distance of hinge axis to residue i in
(A) Change in
(deg) Change in
(deg) Angle of psi(i) axis to hinge axis
(deg) Angle of psi(i) axis to hinge axis
(deg) Percentage Progress
ASN-236
VAL-237
11.1
10.5
160.6
-172.1
38.4
15.7
-145.4
VAL-237
SER-238
9.9
10.2
12.0
6.4
42.1
44.9
259.1
SER-238
VAL-239
11.1
11.3
-8.8
6.4
146.3
145.1
-91.4
VAL-239
VAL-240
11.0
11.1
-9.9
8.9
142.6
142.0
-14.4

Graph shows rotational transition at bending residues and can be used
to identify hinge bending residues.
Probably only informative for interdomain rotations greater than 20 degrees
Residue
iResidue
i+1Distance of hinge axis to residue i in
(A) Distance of hinge axis to residue i in
(A) Change in
(deg) Change in
(deg) Angle of psi(i) axis to hinge axis
(deg) Angle of psi(i) axis to hinge axis
(deg) Percentage Progress
TYR-311
ASP-312
6.0
5.9
8.5
-4.2
157.1
154.9
-74.5
ASP-312
ASN-313
5.9
5.8
19.3
-3.8
91.6
89.8
-3.5
ASN-313
GLU-314
7.3
7.3
-16.1
1.7
37.7
49.0
237.7
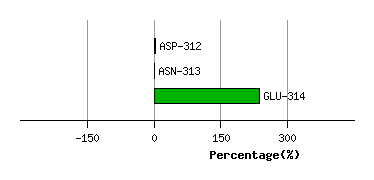
Graph shows rotational transition at bending residues and can be used
to identify hinge bending residues.
Probably only informative for interdomain rotations greater than 20 degrees