Glutamate Receptor Subunit 2
(All numbering and residues are taken from first PDB file)
![]()
![]()
Bending Residue Dihedral Analysis
Residue
iResidue
i+1Distance of hinge axis to residue i in
(A) Distance of hinge axis to residue i in
(A) Change in
(deg) Change in
(deg) Angle of psi(i) axis to hinge axis
(deg) Angle of psi(i) axis to hinge axis
(deg) Percentage Progress
SER-108
LEU-109
4.9
5.3
7.6
-3.2
66.0
66.7
6.8
LEU-109
GLY-110
1.1
1.8
16.6
-30.3
140.3
141.2
36.0
GLY-110
ILE-111
2.2
2.1
13.4
-2.3
65.8
66.7
19.7

Graph shows rotational transition at bending residues and can be used
to identify hinge bending residues.
Probably only informative for interdomain rotations greater than 20 degrees
Residue
iResidue
i+1Distance of hinge axis to residue i in
(A) Distance of hinge axis to residue i in
(A) Change in
(deg) Change in
(deg) Angle of psi(i) axis to hinge axis
(deg) Angle of psi(i) axis to hinge axis
(deg) Percentage Progress
SER-217
LYS-218
1.2
1.5
5.8
21.8
81.9
94.1
1.9
LYS-218
GLY-219
3.3
2.7
-16.4
-2.3
35.4
57.9
48.7
GLY-219
TYR-220
5.8
5.8
-21.0
-2.8
72.3
66.6
30.4
TYR-220
GLY-221
8.3
8.1
9.0
-15.8
76.7
78.3
-1.6
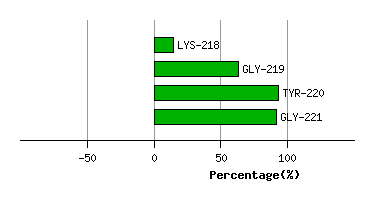
Graph shows rotational transition at bending residues and can be used
to identify hinge bending residues.
Probably only informative for interdomain rotations greater than 20 degrees
Residue
iResidue
i+1Distance of hinge axis to residue i in
(A) Distance of hinge axis to residue i in
(A) Change in
(deg) Change in
(deg) Angle of psi(i) axis to hinge axis
(deg) Angle of psi(i) axis to hinge axis
(deg) Percentage Progress
LYS-253
TRP-254
9.4
9.6
-13.6
3.5
99.6
104.1
-11.8
TRP-254
TRP-255
6.0
6.1
5.4
2.9
105.7
107.1
-21.4
TRP-255
TYR-256
5.1
5.2
-53.9
-50.7
118.7
116.4
-201.2
TYR-256
ASP-257
7.6
8.3
-169.8
42.7
115.4
156.6
859.9
ASP-257
LYS-258
7.9
9.7
-154.9
9.9
148.5
131.4
-628.1
LYS-258
GLY-259
8.6
6.2
-41.8
-81.4
102.9
78.5
-0.8
GLY-259
GLU-260
10.7
6.9
120.3
-65.0
54.0
36.2
160.8
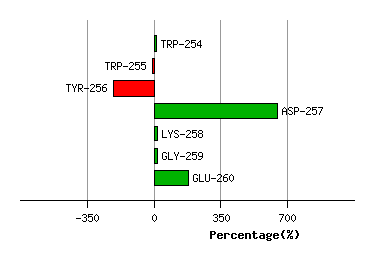
Graph shows rotational transition at bending residues and can be used
to identify hinge bending residues.
Probably only informative for interdomain rotations greater than 20 degrees