Anthranilate Phosphoribosyltransferase
(All numbering and residues are taken from first PDB file)
![]()
![]()
Bending Residue Dihedral Analysis
Residue
iResidue
i+1Distance of hinge axis to residue i in
(A) Distance of hinge axis to residue i in
(A) Change in
(deg) Change in
(deg) Angle of psi(i) axis to hinge axis
(deg) Angle of psi(i) axis to hinge axis
(deg) Percentage Progress
ALA-66
GLY-67
10.6
10.9
-7.4
4.1
25.7
24.8
39.9
GLY-67
ALA-68
11.0
11.2
-4.2
2.4
59.7
63.9
35.3
ALA-68
ALA-69
9.6
9.7
-2.9
0.1
110.8
112.8
6.3
ALA-69
SER-70
6.8
6.9
5.3
-2.5
107.7
105.5
-33.7
SER-70
ALA-71
6.3
6.4
-3.5
-6.3
22.1
25.8
128.1

Graph shows rotational transition at bending residues and can be used
to identify hinge bending residues.
Probably only informative for interdomain rotations greater than 20 degrees
Residue
iResidue
i+1Distance of hinge axis to residue i in
(A) Distance of hinge axis to residue i in
(A) Change in
(deg) Change in
(deg) Angle of psi(i) axis to hinge axis
(deg) Angle of psi(i) axis to hinge axis
(deg) Percentage Progress
ALA-74
ASP-75
3.6
3.4
11.5
-11.1
49.2
45.2
17.6
ASP-75
ALA-76
1.4
1.2
-3.3
-4.8
63.4
67.6
70.5
ALA-76
GLN-77
3.2
3.3
4.4
-1.5
84.3
87.9
13.6
GLN-77
PRO-78
6.9
6.9
0.3
0.8
34.9
31.0
47.2
GLN-77
PRO-78
6.9
6.9
0.3
0.8
34.9
31.0
47.2

Graph shows rotational transition at bending residues and can be used
to identify hinge bending residues.
Probably only informative for interdomain rotations greater than 20 degrees
Residue
iResidue
i+1Distance of hinge axis to residue i in
(A) Distance of hinge axis to residue i in
(A) Change in
(deg) Change in
(deg) Angle of psi(i) axis to hinge axis
(deg) Angle of psi(i) axis to hinge axis
(deg) Percentage Progress
GLN-77
PRO-78
6.9
6.9
0.3
0.8
34.9
31.0
47.2
GLN-77
PRO-78
6.9
6.9
0.3
0.8
34.9
31.0
47.2
PRO-78
PHE-79
8.7
8.5
5.6
-3.3
40.8
44.0
48.3
PHE-79
PRO-80
9.7
9.7
-0.6
7.7
122.5
127.1
59.1
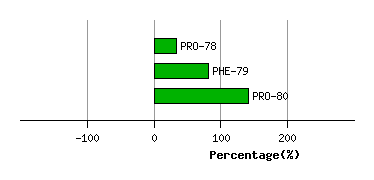
Graph shows rotational transition at bending residues and can be used
to identify hinge bending residues.
Probably only informative for interdomain rotations greater than 20 degrees
Residue
iResidue
i+1Distance of hinge axis to residue i in
(A) Distance of hinge axis to residue i in
(A) Change in
(deg) Change in
(deg) Angle of psi(i) axis to hinge axis
(deg) Angle of psi(i) axis to hinge axis
(deg) Percentage Progress
ALA-118
LYS-119
8.5
8.6
6.1
-4.0
69.1
67.1
-10.9
LYS-119
HIS-120
9.3
9.8
-8.9
11.6
176.7
176.6
25.6
HIS-120
GLY-121
8.9
9.3
-10.2
21.9
100.4
101.4
69.6
GLY-121
ASN-122
11.3
11.9
-5.7
-6.6
154.1
163.0
-165.8
ASN-122
ARG-123
13.1
13.3
-6.0
-21.5
81.9
92.1
-15.7
LEU-129
ALA-130
24.5
24.6
-141.1
-171.1
56.9
20.2
-501.8
ALA-130
GLY-131
23.4
23.2
-46.4
-5.5
67.4
79.2
210.4
GLY-131
SER-132
19.6
19.5
-18.6
6.2
67.6
67.1
77.4
SER-132
CYS-133
17.4
17.4
-1.1
3.9
125.8
125.1
32.0

Graph shows rotational transition at bending residues and can be used
to identify hinge bending residues.
Probably only informative for interdomain rotations greater than 20 degrees
Residue
iResidue
i+1Distance of hinge axis to residue i in
(A) Distance of hinge axis to residue i in
(A) Change in
(deg) Change in
(deg) Angle of psi(i) axis to hinge axis
(deg) Angle of psi(i) axis to hinge axis
(deg) Percentage Progress
CYS-160
PHE-161
13.5
13.6
1.7
-0.8
66.6
61.9
17.3
PHE-161
LEU-162
12.9
13.2
2.8
-4.2
19.5
21.8
-14.2
LEU-162
PHE-163
10.8
11.1
8.3
-5.1
61.0
58.2
11.3

Graph shows rotational transition at bending residues and can be used
to identify hinge bending residues.
Probably only informative for interdomain rotations greater than 20 degrees
Residue
iResidue
i+1Distance of hinge axis to residue i in
(A) Distance of hinge axis to residue i in
(A) Change in
(deg) Change in
(deg) Angle of psi(i) axis to hinge axis
(deg) Angle of psi(i) axis to hinge axis
(deg) Percentage Progress
ASN-188
VAL-189
15.7
15.0
-19.4
30.2
142.0
133.4
98.0
VAL-189
LEU-190
13.2
13.3
-16.0
-4.0
76.8
76.0
125.1
LEU-190
GLY-191
10.0
10.1
0.0
5.9
106.0
105.9
68.4

Graph shows rotational transition at bending residues and can be used
to identify hinge bending residues.
Probably only informative for interdomain rotations greater than 20 degrees