D-Maltodextrin Binding Protein
(All numbering and residues are taken from first PDB file)
![]()
![]()
Bending Residue Dihedral Analysis
Residue
iResidue
i+1Distance of hinge axis to residue i in
(A) Distance of hinge axis to residue i in
(A) Change in
(deg) Change in
(deg) Angle of psi(i) axis to hinge axis
(deg) Angle of psi(i) axis to hinge axis
(deg) Percentage Progress
PRO-107
ILE-108
8.5
8.6
3.5
-4.4
23.1
29.5
-12.8
ILE-108
ALA-109
8.8
8.7
-11.1
26.6
133.3
133.5
23.6
ALA-109
VAL-110
5.5
5.4
5.8
-17.6
115.5
116.8
4.1
VAL-110
GLU-111
1.7
1.8
23.3
-29.0
60.9
65.7
17.7
GLU-111
ALA-112
3.2
2.2
9.5
-21.1
97.5
112.4
20.3
ALA-112
LEU-113
5.3
5.2
19.1
-1.4
53.1
48.0
18.1
LEU-113
SER-114
8.8
8.7
-1.3
-0.2
136.9
133.2
4.3

Graph shows rotational transition at bending residues and can be used
to identify hinge bending residues.
Probably only informative for interdomain rotations greater than 20 degrees
Residue
iResidue
i+1Distance of hinge axis to residue i in
(A) Distance of hinge axis to residue i in
(A) Change in
(deg) Change in
(deg) Angle of psi(i) axis to hinge axis
(deg) Angle of psi(i) axis to hinge axis
(deg) Percentage Progress
PHE-258
VAL-259
7.8
7.4
13.1
-12.0
123.8
124.6
6.1
VAL-259
GLY-260
4.3
3.8
-1.8
0.7
123.6
117.8
8.6
GLY-260
VAL-261
2.9
2.0
-17.0
-4.5
61.0
64.5
48.7
VAL-261
LEU-262
2.9
2.7
7.0
-6.0
81.0
81.1
11.7
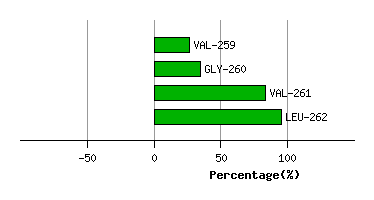
Graph shows rotational transition at bending residues and can be used
to identify hinge bending residues.
Probably only informative for interdomain rotations greater than 20 degrees
Residue
iResidue
i+1Distance of hinge axis to residue i in
(A) Distance of hinge axis to residue i in
(A) Change in
(deg) Change in
(deg) Angle of psi(i) axis to hinge axis
(deg) Angle of psi(i) axis to hinge axis
(deg) Percentage Progress
GLU-309
GLU-310
10.0
10.0
8.6
7.4
30.7
34.4
39.4
GLU-310
LEU-311
9.0
9.2
-19.6
8.0
87.6
93.3
7.5
LEU-311
ALA-312
5.7
5.8
3.3
97.9
79.2
79.6
153.9
ALA-312
LYS-313
4.1
5.3
-109.2
-24.6
107.3
161.1
-111.3
LYS-313
ASP-314
4.7
5.0
18.5
-19.7
76.3
84.0
13.5
ASP-314
PRO-315
0.9
1.5
-3.8
-1.1
70.4
59.8
5.2
PRO-315
ARG-316
3.5
4.5
5.5
-7.4
141.9
143.1
9.4
ARG-316
ILE-317
3.9
4.1
3.2
-1.6
147.1
142.8
-10.4
ILE-317
ALA-318
1.1
1.4
1.9
0.5
100.0
106.6
12.8
ALA-318
ALA-319
4.6
5.0
2.4
1.2
120.0
124.8
-11.0
ALA-319
THR-320
6.4
6.5
-10.5
3.3
16.6
18.9
12.8

Graph shows rotational transition at bending residues and can be used
to identify hinge bending residues.
Probably only informative for interdomain rotations greater than 20 degrees