Inositol 2-Dehydrogenase/d-Chiro-Inositol 3-Dehydrogenase
(All numbering and residues are taken from first PDB file)
![]()
![]()
Bending Residue Dihedral Analysis
Residue
iResidue
i+1Distance of hinge axis to residue i in
(A) Distance of hinge axis to residue i in
(A) Change in
(deg) Change in
(deg) Angle of psi(i) axis to hinge axis
(deg) Angle of psi(i) axis to hinge axis
(deg) Percentage Progress
HIS-17
ILE-18
6.1
6.1
-3.9
7.0
137.5
140.1
14.0
ILE-18
ASN-19
7.8
7.7
-4.4
10.4
150.0
146.2
131.8
ASN-19
ARG-20
7.3
7.3
-6.4
3.7
98.5
95.2
-65.4
ARG-20
ILE-21
4.1
4.0
0.5
-0.7
80.5
76.7
-58.4
ILE-21
THR-22
3.2
3.2
-3.5
-0.9
156.9
161.2
-60.7

Graph shows rotational transition at bending residues and can be used
to identify hinge bending residues.
Probably only informative for interdomain rotations greater than 20 degrees
Residue
iResidue
i+1Distance of hinge axis to residue i in
(A) Distance of hinge axis to residue i in
(A) Change in
(deg) Change in
(deg) Angle of psi(i) axis to hinge axis
(deg) Angle of psi(i) axis to hinge axis
(deg) Percentage Progress
SER-81
SER-82
14.6
14.4
17.0
-14.7
32.8
34.7
36.1
SER-82
VAL-83
13.9
13.7
1.0
3.6
92.4
93.2
35.6
VAL-83
LEU-84
11.1
10.9
6.5
-4.1
116.1
118.8
21.3
LEU-84
LYS-85
13.4
13.4
4.7
-9.7
123.2
126.2
57.8
LEU-84
LYS-85
13.4
13.4
4.7
-9.7
123.2
126.2
57.8

Graph shows rotational transition at bending residues and can be used
to identify hinge bending residues.
Probably only informative for interdomain rotations greater than 20 degrees
Residue
iResidue
i+1Distance of hinge axis to residue i in
(A) Distance of hinge axis to residue i in
(A) Change in
(deg) Change in
(deg) Angle of psi(i) axis to hinge axis
(deg) Angle of psi(i) axis to hinge axis
(deg) Percentage Progress
LEU-84
LYS-85
13.4
13.4
4.7
-9.7
123.2
126.2
57.8
LEU-84
LYS-85
13.4
13.4
4.7
-9.7
123.2
126.2
57.8
LYS-85
ALA-86
16.4
16.2
15.5
-15.7
131.5
133.8
-45.6
ALA-86
ILE-87
14.4
14.3
-2.5
9.1
108.3
110.8
12.3

Graph shows rotational transition at bending residues and can be used
to identify hinge bending residues.
Probably only informative for interdomain rotations greater than 20 degrees
Residue
iResidue
i+1Distance of hinge axis to residue i in
(A) Distance of hinge axis to residue i in
(A) Change in
(deg) Change in
(deg) Angle of psi(i) axis to hinge axis
(deg) Angle of psi(i) axis to hinge axis
(deg) Percentage Progress
LEU-99
ALA-100
5.0
5.1
7.5
-5.3
118.7
123.5
-62.1
ALA-100
THR-101
7.7
7.7
9.8
-5.9
122.4
121.0
-63.1
THR-101
THR-102
9.7
9.5
-2.4
-14.1
11.5
21.3
300.0

Graph shows rotational transition at bending residues and can be used
to identify hinge bending residues.
Probably only informative for interdomain rotations greater than 20 degrees
Residue
iResidue
i+1Distance of hinge axis to residue i in
(A) Distance of hinge axis to residue i in
(A) Change in
(deg) Change in
(deg) Angle of psi(i) axis to hinge axis
(deg) Angle of psi(i) axis to hinge axis
(deg) Percentage Progress
ARG-108
ILE-109
9.9
10.4
2.1
-0.4
152.0
152.0
-54.9
ILE-109
VAL-110
9.2
9.4
-3.4
-4.2
94.1
95.8
-8.8
VAL-110
GLU-111
8.3
8.7
0.6
3.7
77.0
72.1
50.5

Graph shows rotational transition at bending residues and can be used
to identify hinge bending residues.
Probably only informative for interdomain rotations greater than 20 degrees
Residue
iResidue
i+1Distance of hinge axis to residue i in
(A) Distance of hinge axis to residue i in
(A) Change in
(deg) Change in
(deg) Angle of psi(i) axis to hinge axis
(deg) Angle of psi(i) axis to hinge axis
(deg) Percentage Progress
GLN-122
VAL-123
4.3
4.2
-2.8
0.6
84.6
80.3
23.0
VAL-123
GLY-124
0.7
0.8
1.4
2.2
53.6
54.1
75.6
GLY-124
PHE-125
2.3
2.3
-10.0
7.5
70.4
74.6
-43.6

Graph shows rotational transition at bending residues and can be used
to identify hinge bending residues.
Probably only informative for interdomain rotations greater than 20 degrees
Residue
iResidue
i+1Distance of hinge axis to residue i in
(A) Distance of hinge axis to residue i in
(A) Change in
(deg) Change in
(deg) Angle of psi(i) axis to hinge axis
(deg) Angle of psi(i) axis to hinge axis
(deg) Percentage Progress
TYR-280
ASP-281
5.8
6.0
4.6
-1.2
131.2
134.2
-15.1
ASP-281
VAL-282
4.9
5.0
-2.9
3.0
108.3
107.7
4.7
VAL-282
GLU-283
6.6
6.5
-6.9
-0.6
136.6
136.4
-24.7
GLU-283
ILE-284
4.2
4.4
14.2
-6.0
107.5
108.7
74.1
ILE-284
GLN-285
1.7
1.8
0.2
-2.0
120.2
125.0
6.8
GLN-285
ASP-286
4.7
4.6
2.0
1.6
53.3
53.8
28.3
ASP-286
PHE-287
7.0
7.0
-6.8
5.7
113.9
113.8
-42.0
PHE-287
ILE-288
5.9
5.8
4.2
-5.6
50.7
48.4
37.0
PHE-287
ILE-288
5.9
5.8
4.2
-5.6
50.7
48.4
37.0

Graph shows rotational transition at bending residues and can be used
to identify hinge bending residues.
Probably only informative for interdomain rotations greater than 20 degrees
Residue
iResidue
i+1Distance of hinge axis to residue i in
(A) Distance of hinge axis to residue i in
(A) Change in
(deg) Change in
(deg) Angle of psi(i) axis to hinge axis
(deg) Angle of psi(i) axis to hinge axis
(deg) Percentage Progress
PHE-287
ILE-288
5.9
5.8
4.2
-5.6
50.7
48.4
37.0
PHE-287
ILE-288
5.9
5.8
4.2
-5.6
50.7
48.4
37.0
ILE-288
ASP-289
7.4
7.2
9.1
-12.8
85.8
83.7
-30.6
ASP-289
SER-290
9.9
9.9
5.8
-3.2
140.5
140.6
25.0
SER-290
ILE-291
11.1
11.2
-5.3
9.9
87.0
86.1
-27.2
ILE-291
GLN-292
12.0
11.9
1.1
-4.3
45.8
46.0
-13.3

Graph shows rotational transition at bending residues and can be used
to identify hinge bending residues.
Probably only informative for interdomain rotations greater than 20 degrees
Residue
iResidue
i+1Distance of hinge axis to residue i in
(A) Distance of hinge axis to residue i in
(A) Change in
(deg) Change in
(deg) Angle of psi(i) axis to hinge axis
(deg) Angle of psi(i) axis to hinge axis
(deg) Percentage Progress
LYS-294
GLY-295
16.4
16.2
-8.4
3.6
63.1
64.4
38.6
GLY-295
GLU-296
15.9
15.9
-7.7
0.4
33.8
30.4
154.9
GLU-296
VAL-297
13.1
13.2
-6.4
4.2
101.1
98.3
-48.5
VAL-297
SER-298
9.5
9.7
-6.4
-3.1
116.9
120.1
-21.4
VAL-297
SER-298
9.5
9.7
-6.4
-3.1
116.9
120.1
-21.4

Graph shows rotational transition at bending residues and can be used
to identify hinge bending residues.
Probably only informative for interdomain rotations greater than 20 degrees
Residue
iResidue
i+1Distance of hinge axis to residue i in
(A) Distance of hinge axis to residue i in
(A) Change in
(deg) Change in
(deg) Angle of psi(i) axis to hinge axis
(deg) Angle of psi(i) axis to hinge axis
(deg) Percentage Progress
VAL-297
SER-298
9.5
9.7
-6.4
-3.1
116.9
120.1
-21.4
VAL-297
SER-298
9.5
9.7
-6.4
-3.1
116.9
120.1
-21.4
SER-298
GLY-299
9.3
9.8
44.3
-39.4
59.5
71.8
74.3
GLY-299
PRO-300
6.5
6.9
-10.1
8.2
172.5
165.1
-17.6
PRO-300
THR-301
5.1
5.1
6.9
-24.5
67.7
72.7
-25.9

Graph shows rotational transition at bending residues and can be used
to identify hinge bending residues.
Probably only informative for interdomain rotations greater than 20 degrees
Residue
iResidue
i+1Distance of hinge axis to residue i in
(A) Distance of hinge axis to residue i in
(A) Change in
(deg) Change in
(deg) Angle of psi(i) axis to hinge axis
(deg) Angle of psi(i) axis to hinge axis
(deg) Percentage Progress
ALA-308
ALA-309
4.5
4.7
13.9
-14.7
127.4
123.3
41.5
ALA-309
VAL-310
4.5
4.7
0.1
1.1
159.4
159.9
-10.0
VAL-310
THR-311
4.1
4.2
12.7
-17.0
93.7
93.0
28.8

Graph shows rotational transition at bending residues and can be used
to identify hinge bending residues.
Probably only informative for interdomain rotations greater than 20 degrees
Residue
iResidue
i+1Distance of hinge axis to residue i in
(A) Distance of hinge axis to residue i in
(A) Change in
(deg) Change in
(deg) Angle of psi(i) axis to hinge axis
(deg) Angle of psi(i) axis to hinge axis
(deg) Percentage Progress
VAL-327
GLU-328
7.1
7.1
15.4
-8.2
73.2
71.1
91.7
GLU-328
LEU-329
4.3
3.9
-26.3
11.7
40.7
46.4
219.1
LEU-329
LYS-330
3.9
3.9
-3.2
-3.1
107.4
111.9
-9.7
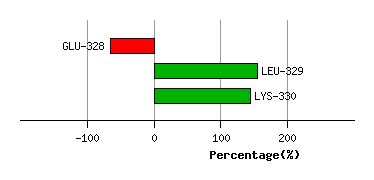
Graph shows rotational transition at bending residues and can be used
to identify hinge bending residues.
Probably only informative for interdomain rotations greater than 20 degrees