Ribokinase
(All numbering and residues are taken from first PDB file)
![]()
![]()
Bending Residue Dihedral Analysis
Residue
iResidue
i+1Distance of hinge axis to residue i in
(A) Distance of hinge axis to residue i in
(A) Change in
(deg) Change in
(deg) Angle of psi(i) axis to hinge axis
(deg) Angle of psi(i) axis to hinge axis
(deg) Percentage Progress
SER-12
ILE-13
5.2
5.1
1.9
-3.9
144.9
147.2
-9.0
ILE-13
ASN-14
4.3
4.4
-1.3
-0.7
75.8
69.7
-0.9
ASN-14
ALA-15
1.1
1.5
0.9
-16.0
148.9
150.9
76.8
ALA-15
ASP-16
2.5
2.6
4.9
-3.8
117.2
117.6
-11.0
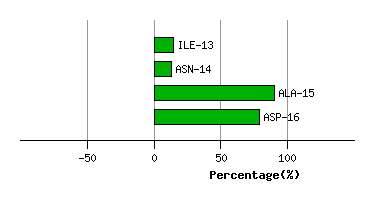
Graph shows rotational transition at bending residues and can be used
to identify hinge bending residues.
Probably only informative for interdomain rotations greater than 20 degrees
Residue
iResidue
i+1Distance of hinge axis to residue i in
(A) Distance of hinge axis to residue i in
(A) Change in
(deg) Change in
(deg) Angle of psi(i) axis to hinge axis
(deg) Angle of psi(i) axis to hinge axis
(deg) Percentage Progress
GLN-37
VAL-38
3.2
2.3
-12.1
0.3
9.2
9.1
35.6
VAL-38
ALA-39
3.8
3.3
-6.6
6.3
85.2
82.8
5.3
ALA-39
PHE-40
3.1
3.1
-19.2
4.9
18.1
10.3
91.0
PHE-40
GLY-41
4.4
4.7
-13.7
20.7
86.0
77.0
-9.6
GLY-41
GLY-42
4.0
4.2
-2.0
-9.7
12.2
9.4
83.2
GLY-42
LYS-43
4.7
4.8
-9.3
7.6
89.8
84.6
-54.9

Graph shows rotational transition at bending residues and can be used
to identify hinge bending residues.
Probably only informative for interdomain rotations greater than 20 degrees
Residue
iResidue
i+1Distance of hinge axis to residue i in
(A) Distance of hinge axis to residue i in
(A) Change in
(deg) Change in
(deg) Angle of psi(i) axis to hinge axis
(deg) Angle of psi(i) axis to hinge axis
(deg) Percentage Progress
ASP-66
ASP-67
12.2
12.7
4.3
-31.8
134.8
145.4
129.2
ASP-67
SER-68
12.0
12.7
-4.0
2.8
45.0
42.2
36.9
SER-68
ILE-69
12.8
13.5
-2.6
8.5
75.7
71.8
-18.0
ILE-69
GLY-70
9.4
9.9
-7.9
6.6
136.0
126.3
19.2
GLY-70
GLU-71
9.5
9.7
-3.7
14.8
87.8
78.3
6.5
GLU-71
SER-72
13.2
13.1
-33.8
45.3
33.5
32.7
-56.7
SER-72
VAL-73
12.6
12.1
-26.6
11.3
88.3
95.3
-57.5

Graph shows rotational transition at bending residues and can be used
to identify hinge bending residues.
Probably only informative for interdomain rotations greater than 20 degrees
Residue
iResidue
i+1Distance of hinge axis to residue i in
(A) Distance of hinge axis to residue i in
(A) Change in
(deg) Change in
(deg) Angle of psi(i) axis to hinge axis
(deg) Angle of psi(i) axis to hinge axis
(deg) Percentage Progress
GLY-96
VAL-97
2.5
2.6
-6.3
-12.1
15.7
13.2
134.1
VAL-97
ALA-98
3.8
3.4
7.2
-10.2
104.3
102.7
-70.7
ALA-98
LEU-99
4.7
4.3
-17.3
11.1
38.3
32.6
44.5

Graph shows rotational transition at bending residues and can be used
to identify hinge bending residues.
Probably only informative for interdomain rotations greater than 20 degrees
Residue
iResidue
i+1Distance of hinge axis to residue i in
(A) Distance of hinge axis to residue i in
(A) Change in
(deg) Change in
(deg) Angle of psi(i) axis to hinge axis
(deg) Angle of psi(i) axis to hinge axis
(deg) Percentage Progress
HIS-113
ALA-114
6.3
6.1
-6.8
-2.6
64.6
61.3
79.4
ALA-114
GLY-115
3.5
3.6
4.4
-2.2
88.3
95.1
28.1
GLY-115
ALA-116
4.4
4.5
0.5
10.1
126.5
130.7
-26.2
ALA-116
ASN-117
4.0
4.2
-12.3
5.3
81.1
73.6
34.5
ASN-117
ALA-118
1.6
1.5
0.7
-8.8
158.6
152.5
6.7

Graph shows rotational transition at bending residues and can be used
to identify hinge bending residues.
Probably only informative for interdomain rotations greater than 20 degrees