Glutamate Receptor Subunit 2
(All numbering and residues are taken from first PDB file)
![]()
![]()
Bending Residue Dihedral Analysis
Residue
iResidue
i+1Distance of hinge axis to residue i in
(A) Distance of hinge axis to residue i in
(A) Change in
(deg) Change in
(deg) Angle of psi(i) axis to hinge axis
(deg) Angle of psi(i) axis to hinge axis
(deg) Percentage Progress
SER-108
LEU-109
2.5
2.6
-13.5
-0.6
15.2
17.7
56.2
LEU-109
GLY-110
1.1
1.0
15.7
-0.1
90.6
93.7
10.5
GLY-110
ILE-111
3.3
3.3
-7.3
4.3
15.1
17.6
14.6
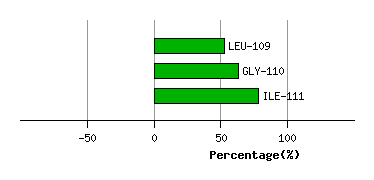
Graph shows rotational transition at bending residues and can be used
to identify hinge bending residues.
Probably only informative for interdomain rotations greater than 20 degrees
Residue
iResidue
i+1Distance of hinge axis to residue i in
(A) Distance of hinge axis to residue i in
(A) Change in
(deg) Change in
(deg) Angle of psi(i) axis to hinge axis
(deg) Angle of psi(i) axis to hinge axis
(deg) Percentage Progress
SER-194
THR-195
0.5
0.8
-4.7
-0.7
94.7
93.7
-17.9
THR-195
MET-196
4.3
4.3
12.0
-8.8
26.8
32.3
8.1
MET-196
ASN-197
5.4
5.7
12.7
-6.9
43.1
40.4
40.0

Graph shows rotational transition at bending residues and can be used
to identify hinge bending residues.
Probably only informative for interdomain rotations greater than 20 degrees
Residue
iResidue
i+1Distance of hinge axis to residue i in
(A) Distance of hinge axis to residue i in
(A) Change in
(deg) Change in
(deg) Angle of psi(i) axis to hinge axis
(deg) Angle of psi(i) axis to hinge axis
(deg) Percentage Progress
GLU-201
GLN-202
6.5
6.7
4.5
-1.6
97.8
96.4
-10.3
GLN-202
ARG-203
10.2
10.4
-0.7
-4.0
56.5
50.8
32.2
ARG-203
LYS-204
10.8
10.8
-1.2
7.6
14.1
18.6
-60.6
LYS-204
PRO-205
11.3
11.2
1.9
-10.2
104.3
108.6
26.1
PRO-205
CYS-206
9.5
9.5
12.4
-3.4
71.6
66.0
34.3
CYS-206
ASP-207
8.5
8.6
5.5
-0.7
115.3
115.7
-24.3
ASP-207
THR-208
5.2
5.4
0.4
1.2
53.1
54.8
18.3
THR-208
MET-209
3.2
3.2
-2.7
-3.6
129.6
135.9
-16.4
MET-209
LYS-210
4.5
4.2
18.9
-10.3
42.8
50.3
26.5
LYS-210
VAL-211
4.2
4.1
5.0
8.5
83.1
88.9
15.7
VAL-211
GLY-212
7.1
7.2
-7.3
-4.6
140.9
142.2
-56.0
GLY-212
GLY-213
9.1
9.4
15.2
-8.8
28.4
34.8
39.0
GLY-213
ASN-214
8.5
8.4
15.0
-17.0
80.4
82.6
-6.0
ASN-214
LEU-215
6.0
6.2
12.8
0.8
73.6
69.9
25.6
LEU-215
ASP-216
8.6
8.8
7.6
-7.3
22.8
15.1
7.5
ASP-216
SER-217
7.5
7.6
-8.7
2.1
112.7
110.6
-3.5
SER-217
LYS-218
4.6
4.8
-12.9
-9.4
113.9
126.1
-119.9
LYS-218
GLY-219
4.5
4.1
8.6
4.4
77.4
90.2
22.2
GLY-219
TYR-220
4.5
4.3
14.4
-6.1
95.8
94.3
-2.6
TYR-220
GLY-221
7.8
7.8
-4.2
10.4
154.2
150.7
40.4
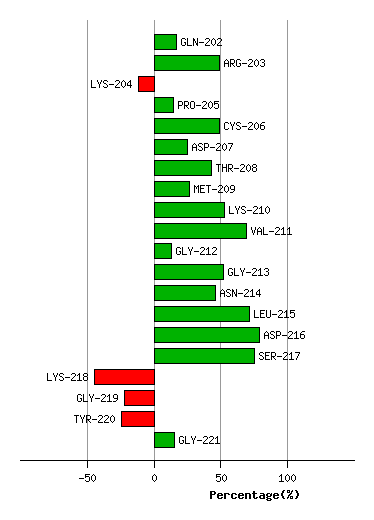
Graph shows rotational transition at bending residues and can be used
to identify hinge bending residues.
Probably only informative for interdomain rotations greater than 20 degrees