Udp-Sugar Pyrophosphorylase
(All numbering and residues are taken from first PDB file)
![]()
![]()
Bending Residue Dihedral Analysis
Residue
iResidue
i+1Distance of hinge axis to residue i in
(A) Distance of hinge axis to residue i in
(A) Change in
(deg) Change in
(deg) Angle of psi(i) axis to hinge axis
(deg) Angle of psi(i) axis to hinge axis
(deg) Percentage Progress
CYS-298
ILE-299
4.9
5.0
3.9
-13.1
160.8
158.7
39.8
ILE-299
PRO-300
3.8
3.8
0.4
6.5
85.5
83.3
10.7
PRO-300
ARG-301
2.2
2.6
-0.6
13.0
102.2
110.4
57.4

Graph shows rotational transition at bending residues and can be used
to identify hinge bending residues.
Probably only informative for interdomain rotations greater than 20 degrees
Residue
iResidue
i+1Distance of hinge axis to residue i in
(A) Distance of hinge axis to residue i in
(A) Change in
(deg) Change in
(deg) Angle of psi(i) axis to hinge axis
(deg) Angle of psi(i) axis to hinge axis
(deg) Percentage Progress
VAL-302
PRO-303
8.9
9.3
-15.0
20.2
27.7
30.0
-22.4
PRO-303
LYS-304
11.0
11.3
-41.6
35.2
74.9
55.2
79.0
LYS-304
GLU-305
13.1
13.5
-87.1
69.5
87.3
70.0
125.6
GLU-305
PRO-306
11.6
12.0
9.4
1.3
159.6
149.8
-103.7
PRO-306
ILE-307
12.4
12.3
12.4
-1.5
98.1
91.8
-21.3
PRO-306
ILE-307
12.4
12.3
12.4
-1.5
98.1
91.8
-21.3

Graph shows rotational transition at bending residues and can be used
to identify hinge bending residues.
Probably only informative for interdomain rotations greater than 20 degrees
Residue
iResidue
i+1Distance of hinge axis to residue i in
(A) Distance of hinge axis to residue i in
(A) Change in
(deg) Change in
(deg) Angle of psi(i) axis to hinge axis
(deg) Angle of psi(i) axis to hinge axis
(deg) Percentage Progress
PRO-306
ILE-307
12.4
12.3
12.4
-1.5
98.1
91.8
-21.3
PRO-306
ILE-307
12.4
12.3
12.4
-1.5
98.1
91.8
-21.3
ILE-307
GLY-308
9.0
8.9
-1.4
-1.6
62.1
60.1
-6.5
GLY-308
LEU-309
6.2
6.1
13.6
-10.2
59.5
57.8
18.7

Graph shows rotational transition at bending residues and can be used
to identify hinge bending residues.
Probably only informative for interdomain rotations greater than 20 degrees
Residue
iResidue
i+1Distance of hinge axis to residue i in
(A) Distance of hinge axis to residue i in
(A) Change in
(deg) Change in
(deg) Angle of psi(i) axis to hinge axis
(deg) Angle of psi(i) axis to hinge axis
(deg) Percentage Progress
VAL-323
ALA-324
5.4
6.0
10.6
-14.6
84.1
77.7
-1.6
ALA-324
ASN-325
2.5
3.1
-6.4
8.0
51.7
55.6
-6.4
ASN-325
VAL-326
2.6
2.5
9.9
12.7
57.6
53.0
117.9

Graph shows rotational transition at bending residues and can be used
to identify hinge bending residues.
Probably only informative for interdomain rotations greater than 20 degrees
Residue
iResidue
i+1Distance of hinge axis to residue i in
(A) Distance of hinge axis to residue i in
(A) Change in
(deg) Change in
(deg) Angle of psi(i) axis to hinge axis
(deg) Angle of psi(i) axis to hinge axis
(deg) Percentage Progress
ALA-337
LEU-338
16.6
17.0
-61.8
88.1
89.2
95.3
-2.3
GLY-351
PHE-352
9.4
10.7
-7.7
-12.8
29.7
48.9
121.3
PHE-352
SER-353
7.2
7.9
7.1
-10.4
137.0
151.7
1.3
SER-353
PRO-354
7.5
7.6
-5.2
7.0
96.2
88.7
-77.6
PRO-354
PHE-355
7.3
7.8
-4.3
-25.6
59.5
77.7
74.4
PRO-354
PHE-355
7.3
7.8
-4.3
-25.6
59.5
77.7
74.4
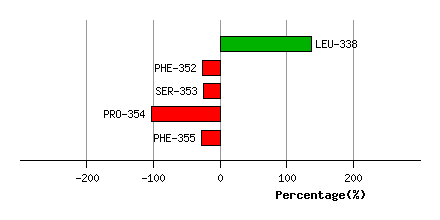
Graph shows rotational transition at bending residues and can be used
to identify hinge bending residues.
Probably only informative for interdomain rotations greater than 20 degrees
Residue
iResidue
i+1Distance of hinge axis to residue i in
(A) Distance of hinge axis to residue i in
(A) Change in
(deg) Change in
(deg) Angle of psi(i) axis to hinge axis
(deg) Angle of psi(i) axis to hinge axis
(deg) Percentage Progress
PRO-354
PHE-355
7.3
7.8
-4.3
-25.6
59.5
77.7
74.4
PRO-354
PHE-355
7.3
7.8
-4.3
-25.6
59.5
77.7
74.4
PHE-355
PRO-356
4.4
4.3
33.9
0.2
66.6
64.1
109.3
PRO-356
GLY-357
0.9
0.8
-6.9
14.8
52.9
58.6
-28.7

Graph shows rotational transition at bending residues and can be used
to identify hinge bending residues.
Probably only informative for interdomain rotations greater than 20 degrees