Glutamate Receptor Subunit 2
(All numbering and residues are taken from first PDB file)
![]()
![]()
Bending Residue Dihedral Analysis
Residue
iResidue
i+1Distance of hinge axis to residue i in
(A) Distance of hinge axis to residue i in
(A) Change in
(deg) Change in
(deg) Angle of psi(i) axis to hinge axis
(deg) Angle of psi(i) axis to hinge axis
(deg) Percentage Progress
MET-107
SER-108
4.3
4.2
-1.5
3.5
159.2
159.1
57.4
SER-108
LEU-109
4.7
4.4
-1.6
5.9
103.1
102.3
-64.5
LEU-109
GLY-110
3.4
3.2
-5.0
11.3
163.0
159.0
137.5
GLY-110
ILE-111
4.6
4.7
-0.8
-6.1
102.8
101.4
-67.2
ILE-111
SER-112
6.4
6.5
0.2
1.7
111.7
111.1
-16.2
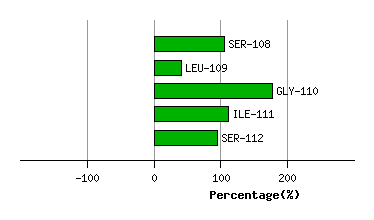
Graph shows rotational transition at bending residues and can be used
to identify hinge bending residues.
Probably only informative for interdomain rotations greater than 20 degrees
Residue
iResidue
i+1Distance of hinge axis to residue i in
(A) Distance of hinge axis to residue i in
(A) Change in
(deg) Change in
(deg) Angle of psi(i) axis to hinge axis
(deg) Angle of psi(i) axis to hinge axis
(deg) Percentage Progress
LEU-215
ASP-216
9.2
9.1
-3.5
4.1
75.3
74.7
25.9
ASP-216
SER-217
6.9
6.7
3.3
-5.2
28.4
29.3
-39.4
SER-217
LYS-218
6.4
6.1
4.0
-2.5
93.5
97.5
20.8
LYS-218
GLY-219
4.2
4.0
2.1
6.1
18.5
18.2
132.8
GLY-219
TYR-220
4.9
4.8
-0.2
3.7
97.5
99.4
-50.6

Graph shows rotational transition at bending residues and can be used
to identify hinge bending residues.
Probably only informative for interdomain rotations greater than 20 degrees
Residue
iResidue
i+1Distance of hinge axis to residue i in
(A) Distance of hinge axis to residue i in
(A) Change in
(deg) Change in
(deg) Angle of psi(i) axis to hinge axis
(deg) Angle of psi(i) axis to hinge axis
(deg) Percentage Progress
TRP-254
TRP-255
4.8
5.0
-4.3
9.3
124.1
123.6
69.8
TRP-255
TYR-256
6.4
6.5
-4.2
5.9
58.3
55.8
-38.6
TYR-256
ASP-257
8.3
8.3
-12.7
8.8
15.8
20.4
3.4

Graph shows rotational transition at bending residues and can be used
to identify hinge bending residues.
Probably only informative for interdomain rotations greater than 20 degrees