D-Galactose/d-Glucose Binding Protein (/Ggbp)
(All numbering and residues are taken from first PDB file)
![]()
![]()
Bending Residue Dihedral Analysis
Residue
iResidue
i+1Distance of hinge axis to residue i in
(A) Distance of hinge axis to residue i in
(A) Change in
(deg) Change in
(deg) Angle of psi(i) axis to hinge axis
(deg) Angle of psi(i) axis to hinge axis
(deg) Percentage Progress
LYS-11
TYR-12
6.7
6.5
-6.5
-0.9
97.0
102.7
-207.8
TYR-12
ASP-13
4.4
4.3
2.1
-9.8
63.1
65.7
-305.7
ASP-13
ASP-14
2.3
2.1
2.0
1.4
125.7
121.5
203.1
ASP-14
ASN-15
3.5
3.4
-0.7
-8.7
83.8
83.0
107.4
ASN-15
PHE-16
3.8
3.6
8.5
-9.4
152.4
154.4
83.7

Graph shows rotational transition at bending residues and can be used
to identify hinge bending residues.
Probably only informative for interdomain rotations greater than 20 degrees
Residue
iResidue
i+1Distance of hinge axis to residue i in
(A) Distance of hinge axis to residue i in
(A) Change in
(deg) Change in
(deg) Angle of psi(i) axis to hinge axis
(deg) Angle of psi(i) axis to hinge axis
(deg) Percentage Progress
ARG-21
LYS-22
5.8
5.9
0.5
-0.4
99.3
100.8
87.6
LYS-22
ALA-23
8.4
8.4
-6.6
5.0
144.5
141.8
13.1
ALA-23
ILE-24
9.3
9.5
5.0
-0.5
62.5
60.2
-130.8
ILE-24
GLU-25
9.5
9.5
-4.4
4.8
61.3
62.1
126.9

Graph shows rotational transition at bending residues and can be used
to identify hinge bending residues.
Probably only informative for interdomain rotations greater than 20 degrees
Residue
iResidue
i+1Distance of hinge axis to residue i in
(A) Distance of hinge axis to residue i in
(A) Change in
(deg) Change in
(deg) Angle of psi(i) axis to hinge axis
(deg) Angle of psi(i) axis to hinge axis
(deg) Percentage Progress
GLN-26
ASP-27
13.8
14.1
0.6
3.4
25.7
25.0
32.7
ASP-27
ALA-28
13.9
14.2
-7.2
5.4
93.5
88.3
-52.9
ALA-28
LYS-29
15.6
15.7
-6.6
-17.3
67.7
65.0
374.8
LYS-29
ALA-30
18.2
18.2
-2.6
17.3
136.6
122.4
64.9
ALA-30
ALA-31
19.6
19.5
-20.0
10.9
131.9
138.3
-211.0
ALA-31
PRO-32
20.0
20.0
12.0
-6.0
125.0
111.7
-32.7
PRO-32
ASP-33
23.2
23.3
9.7
-11.2
82.6
74.8
-92.9
ASP-33
VAL-34
23.5
23.2
22.0
-20.5
102.8
100.3
2.5

Graph shows rotational transition at bending residues and can be used
to identify hinge bending residues.
Probably only informative for interdomain rotations greater than 20 degrees
Residue
iResidue
i+1Distance of hinge axis to residue i in
(A) Distance of hinge axis to residue i in
(A) Change in
(deg) Change in
(deg) Angle of psi(i) axis to hinge axis
(deg) Angle of psi(i) axis to hinge axis
(deg) Percentage Progress
ALA-105
TYR-106
12.4
12.3
0.9
-1.4
108.6
107.5
-51.9
TYR-106
TYR-107
8.6
8.6
-1.4
4.4
136.7
136.8
14.9
TYR-107
VAL-108
5.8
5.8
1.3
6.1
87.8
86.9
-88.2
VAL-108
GLY-109
2.6
2.5
0.1
16.6
53.2
54.7
212.2

Graph shows rotational transition at bending residues and can be used
to identify hinge bending residues.
Probably only informative for interdomain rotations greater than 20 degrees
Residue
iResidue
i+1Distance of hinge axis to residue i in
(A) Distance of hinge axis to residue i in
(A) Change in
(deg) Change in
(deg) Angle of psi(i) axis to hinge axis
(deg) Angle of psi(i) axis to hinge axis
(deg) Percentage Progress
ASN-256
ASP-257
8.2
8.2
1.5
-1.2
93.8
95.8
-5.7
ASP-257
ALA-258
7.8
7.7
-4.7
8.2
72.8
72.8
24.1
ALA-258
ASN-259
5.7
5.9
-1.3
-8.0
107.8
109.6
-98.1
ASN-259
ASN-260
8.6
8.7
4.5
-5.5
23.0
21.7
114.4
ASN-260
GLN-261
7.8
8.0
10.5
-7.3
88.7
81.5
-169.2
GLN-261
ALA-262
4.2
4.4
1.7
-7.7
113.6
115.3
146.4
GLN-261
ALA-262
4.2
4.4
1.7
-7.7
113.6
115.3
146.4

Graph shows rotational transition at bending residues and can be used
to identify hinge bending residues.
Probably only informative for interdomain rotations greater than 20 degrees
Residue
iResidue
i+1Distance of hinge axis to residue i in
(A) Distance of hinge axis to residue i in
(A) Change in
(deg) Change in
(deg) Angle of psi(i) axis to hinge axis
(deg) Angle of psi(i) axis to hinge axis
(deg) Percentage Progress
GLN-261
ALA-262
4.2
4.4
1.7
-7.7
113.6
115.3
146.4
GLN-261
ALA-262
4.2
4.4
1.7
-7.7
113.6
115.3
146.4
ALA-262
LYS-263
6.3
6.3
10.5
-1.1
49.9
56.0
143.9
LYS-263
ALA-264
9.1
9.2
-8.5
8.0
142.5
141.9
-118.1
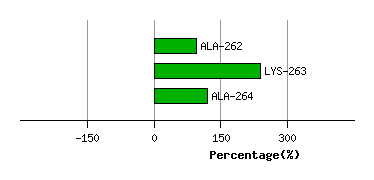
Graph shows rotational transition at bending residues and can be used
to identify hinge bending residues.
Probably only informative for interdomain rotations greater than 20 degrees
Residue
iResidue
i+1Distance of hinge axis to residue i in
(A) Distance of hinge axis to residue i in
(A) Change in
(deg) Change in
(deg) Angle of psi(i) axis to hinge axis
(deg) Angle of psi(i) axis to hinge axis
(deg) Percentage Progress
ASN-283
TRP-284
11.2
11.1
16.6
-19.3
82.6
73.3
-39.1
TRP-284
LYS-285
7.6
7.5
-0.5
-2.4
32.4
34.4
-46.6
LYS-285
ILE-286
4.9
4.9
7.1
-4.6
75.7
75.2
-76.7

Graph shows rotational transition at bending residues and can be used
to identify hinge bending residues.
Probably only informative for interdomain rotations greater than 20 degrees