Bovine Mitochondrial F1-Atpase
(All numbering and residues are taken from first PDB file)
![]()
![]()
Bending Residue Dihedral Analysis
Residue
iResidue
i+1Distance of hinge axis to residue i in
(A) Distance of hinge axis to residue i in
(A) Change in
(deg) Change in
(deg) Angle of psi(i) axis to hinge axis
(deg) Angle of psi(i) axis to hinge axis
(deg) Percentage Progress
ALA-114
ALA-115
11.3
11.2
-2.6
14.9
30.3
30.5
-381.1
ALA-115
ILE-116
13.2
13.2
12.7
-15.6
131.3
132.4
324.1
ILE-116
HIS-117
10.9
11.0
6.3
-7.6
131.4
134.5
-6.7

Graph shows rotational transition at bending residues and can be used
to identify hinge bending residues.
Probably only informative for interdomain rotations greater than 20 degrees
Residue
iResidue
i+1Distance of hinge axis to residue i in
(A) Distance of hinge axis to residue i in
(A) Change in
(deg) Change in
(deg) Angle of psi(i) axis to hinge axis
(deg) Angle of psi(i) axis to hinge axis
(deg) Percentage Progress
VAL-182
PHE-183
4.8
4.7
3.2
-0.8
23.3
26.6
87.0
PHE-183
ALA-184
7.0
7.0
3.6
-2.0
72.2
71.3
-38.3
ALA-184
GLY-185
6.4
6.4
-5.8
9.6
148.0
147.4
185.0
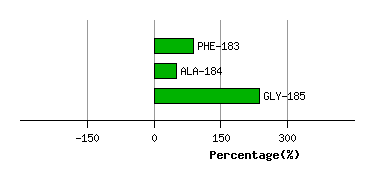
Graph shows rotational transition at bending residues and can be used
to identify hinge bending residues.
Probably only informative for interdomain rotations greater than 20 degrees
Residue
iResidue
i+1Distance of hinge axis to residue i in
(A) Distance of hinge axis to residue i in
(A) Change in
(deg) Change in
(deg) Angle of psi(i) axis to hinge axis
(deg) Angle of psi(i) axis to hinge axis
(deg) Percentage Progress
TYR-242
PHE-243
4.7
4.9
3.4
-6.3
64.4
66.8
75.0
PHE-243
ARG-244
3.4
3.3
-10.0
16.1
75.4
74.5
-45.7
ARG-244
ASP-245
6.7
6.5
-9.1
4.6
121.5
130.5
166.4

Graph shows rotational transition at bending residues and can be used
to identify hinge bending residues.
Probably only informative for interdomain rotations greater than 20 degrees
Residue
iResidue
i+1Distance of hinge axis to residue i in
(A) Distance of hinge axis to residue i in
(A) Change in
(deg) Change in
(deg) Angle of psi(i) axis to hinge axis
(deg) Angle of psi(i) axis to hinge axis
(deg) Percentage Progress
LEU-253
PHE-254
4.8
4.6
-5.4
7.0
143.1
149.5
201.5
PHE-254
ILE-255
6.2
6.1
3.5
2.9
64.5
65.1
-74.0
ILE-255
ASP-256
4.8
4.7
-2.4
8.2
143.0
140.9
148.0

Graph shows rotational transition at bending residues and can be used
to identify hinge bending residues.
Probably only informative for interdomain rotations greater than 20 degrees
Residue
iResidue
i+1Distance of hinge axis to residue i in
(A) Distance of hinge axis to residue i in
(A) Change in
(deg) Change in
(deg) Angle of psi(i) axis to hinge axis
(deg) Angle of psi(i) axis to hinge axis
(deg) Percentage Progress
GLY-290
THR-291
10.1
10.0
8.5
-0.6
19.6
23.5
201.9
THR-291
MET-292
11.4
11.3
-16.2
13.6
124.7
128.6
-79.2
MET-292
GLN-293
7.9
7.8
12.0
-15.7
81.2
80.8
-102.8

Graph shows rotational transition at bending residues and can be used
to identify hinge bending residues.
Probably only informative for interdomain rotations greater than 20 degrees
Residue
iResidue
i+1Distance of hinge axis to residue i in
(A) Distance of hinge axis to residue i in
(A) Change in
(deg) Change in
(deg) Angle of psi(i) axis to hinge axis
(deg) Angle of psi(i) axis to hinge axis
(deg) Percentage Progress
THR-318
ASP-319
3.8
3.6
4.7
-10.6
103.1
100.6
210.9
ASP-319
PRO-320
0.1
0.0
7.6
-8.1
130.1
131.0
1.6
PRO-320
ALA-321
3.5
3.4
4.3
6.3
165.4
167.5
-208.4
ALA-321
PRO-322
2.0
2.0
-2.4
-4.8
71.7
71.4
43.0
PRO-322
ALA-323
2.2
2.2
7.8
-11.0
77.7
75.8
168.7

Graph shows rotational transition at bending residues and can be used
to identify hinge bending residues.
Probably only informative for interdomain rotations greater than 20 degrees