Isocitrate Dehydrogenase
(All numbering and residues are taken from first PDB file)
![]()
![]()
Bending Residue Dihedral Analysis
Residue
iResidue
i+1Distance of hinge axis to residue i in
(A) Distance of hinge axis to residue i in
(A) Change in
(deg) Change in
(deg) Angle of psi(i) axis to hinge axis
(deg) Angle of psi(i) axis to hinge axis
(deg) Percentage Progress
TYR-132
ALA-133
1.7
1.7
-8.3
15.0
142.8
145.6
27.4
ALA-133
ASN-134
2.3
2.4
-2.9
9.3
141.9
143.1
12.9
ASN-134
ILE-135
2.6
2.8
14.0
-12.2
37.8
41.8
27.1

Graph shows rotational transition at bending residues and can be used
to identify hinge bending residues.
Probably only informative for interdomain rotations greater than 20 degrees
Residue
iResidue
i+1Distance of hinge axis to residue i in
(A) Distance of hinge axis to residue i in
(A) Change in
(deg) Change in
(deg) Angle of psi(i) axis to hinge axis
(deg) Angle of psi(i) axis to hinge axis
(deg) Percentage Progress
MET-330
ASN-331
2.9
2.9
22.7
-26.1
25.9
29.6
-56.2
ASN-331
MET-332
3.1
2.7
25.8
-15.0
58.5
58.2
63.4
MET-332
GLY-333
3.0
3.1
16.7
-3.1
15.1
15.9
72.2

Graph shows rotational transition at bending residues and can be used
to identify hinge bending residues.
Probably only informative for interdomain rotations greater than 20 degrees
Residue
iResidue
i+1Distance of hinge axis to residue i in
(A) Distance of hinge axis to residue i in
(A) Change in
(deg) Change in
(deg) Angle of psi(i) axis to hinge axis
(deg) Angle of psi(i) axis to hinge axis
(deg) Percentage Progress
ARG-400
HIS-401
13.5
13.5
25.5
-22.6
72.2
74.7
24.2
HIS-401
MET-402
11.9
11.4
-18.3
32.1
145.9
141.0
64.1
MET-402
PRO-403
10.5
9.5
-39.6
18.7
137.2
139.0
-28.4
PRO-403
GLY-404
11.9
11.7
-11.4
-6.0
112.7
121.1
-38.3
GLY-404
VAL-405
11.3
12.4
24.5
-14.6
126.0
118.1
-3.6
VAL-405
GLN-406
10.2
11.1
16.2
-3.7
108.5
115.4
-15.3
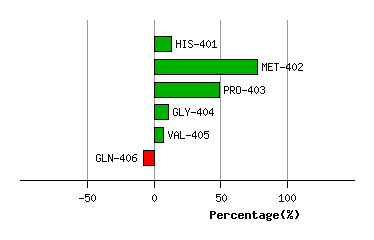
Graph shows rotational transition at bending residues and can be used
to identify hinge bending residues.
Probably only informative for interdomain rotations greater than 20 degrees