Beta-Secretase
(All numbering and residues are taken from first PDB file)
![]()
![]()
Bending Residue Dihedral Analysis
Residue
iResidue
i+1Distance of hinge axis to residue i in
(A) Distance of hinge axis to residue i in
(A) Change in
(deg) Change in
(deg) Angle of psi(i) axis to hinge axis
(deg) Angle of psi(i) axis to hinge axis
(deg) Percentage Progress
ASP-62
LEU-63
9.9
9.9
-6.5
7.0
42.1
40.5
3.4
LEU-63
ARG-64
7.3
7.3
-6.6
4.9
68.1
69.2
5.1
ARG-64
LYS-65
5.6
5.5
-5.5
4.2
87.8
85.7
4.4
LYS-65
GLY-66
2.0
1.9
-7.6
12.0
160.4
158.6
33.4
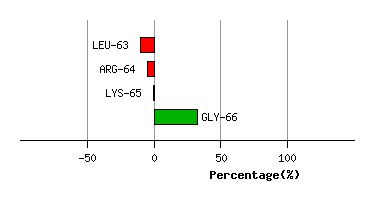
Graph shows rotational transition at bending residues and can be used
to identify hinge bending residues.
Probably only informative for interdomain rotations greater than 20 degrees
Residue
iResidue
i+1Distance of hinge axis to residue i in
(A) Distance of hinge axis to residue i in
(A) Change in
(deg) Change in
(deg) Angle of psi(i) axis to hinge axis
(deg) Angle of psi(i) axis to hinge axis
(deg) Percentage Progress
GLU-77
GLY-78
3.0
3.2
-7.6
10.2
94.1
90.5
-22.7
GLY-78
GLU-79
1.2
0.9
-12.1
1.8
160.3
159.6
-79.3
GLU-79
LEU-80
3.2
3.2
-3.1
0.2
95.8
97.1
13.4

Graph shows rotational transition at bending residues and can be used
to identify hinge bending residues.
Probably only informative for interdomain rotations greater than 20 degrees
Residue
iResidue
i+1Distance of hinge axis to residue i in
(A) Distance of hinge axis to residue i in
(A) Change in
(deg) Change in
(deg) Angle of psi(i) axis to hinge axis
(deg) Angle of psi(i) axis to hinge axis
(deg) Percentage Progress
GLU-104
SER-105
4.9
4.9
4.3
-4.9
68.7
68.6
6.8
SER-105
ASP-106
4.5
4.5
5.7
-11.3
47.1
50.3
-39.0
ASP-106
LYS-107
7.2
7.3
3.0
-0.1
59.2
60.3
14.8

Graph shows rotational transition at bending residues and can be used
to identify hinge bending residues.
Probably only informative for interdomain rotations greater than 20 degrees
Residue
iResidue
i+1Distance of hinge axis to residue i in
(A) Distance of hinge axis to residue i in
(A) Change in
(deg) Change in
(deg) Angle of psi(i) axis to hinge axis
(deg) Angle of psi(i) axis to hinge axis
(deg) Percentage Progress
SER-113
ASN-114
5.9
6.0
16.2
-12.9
81.2
77.7
19.0
ASN-114
TRP-115
7.0
7.5
19.3
-21.5
24.6
22.8
-14.3
TRP-115
GLU-116
7.8
7.8
-2.7
-3.1
126.1
128.6
-23.2
GLU-116
GLY-117
6.6
6.5
-1.8
4.6
162.5
159.2
27.7
GLY-117
ILE-118
7.3
7.3
-1.3
-0.1
86.6
86.0
3.8
ILE-118
LEU-119
9.3
9.3
0.4
-0.9
43.9
43.3
5.1

Graph shows rotational transition at bending residues and can be used
to identify hinge bending residues.
Probably only informative for interdomain rotations greater than 20 degrees