Tick-Borne Encephalitis Virus Glycoprotein
(All numbering and residues are taken from first PDB file)
![]()
![]()
Bending Residue Dihedral Analysis
Residue
iResidue
i+1Distance of hinge axis to residue i in
(A) Distance of hinge axis to residue i in
(A) Change in
(deg) Change in
(deg) Angle of psi(i) axis to hinge axis
(deg) Angle of psi(i) axis to hinge axis
(deg) Percentage Progress
LYS-64
LEU-65
5.2
5.3
10.0
-12.3
112.5
110.5
-20.9
LEU-65
SER-66
7.5
7.4
6.9
38.1
138.9
140.5
-597.1
SER-66
ASP-67
6.7
7.2
56.1
-126.6
122.4
137.3
910.4
ASP-67
THR-68
8.9
8.8
19.1
34.2
77.1
74.3
57.4
THR-68
LYS-69
12.5
12.6
23.4
-8.7
118.9
112.4
-195.8
LYS-69
VAL-70
15.1
15.0
1.4
-5.5
94.0
92.5
-63.1
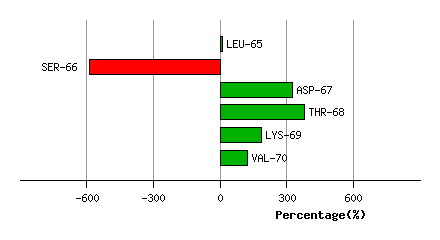
Graph shows rotational transition at bending residues and can be used
to identify hinge bending residues.
Probably only informative for interdomain rotations greater than 20 degrees
Residue
iResidue
i+1Distance of hinge axis to residue i in
(A) Distance of hinge axis to residue i in
(A) Change in
(deg) Change in
(deg) Angle of psi(i) axis to hinge axis
(deg) Angle of psi(i) axis to hinge axis
(deg) Percentage Progress
CYS-116
VAL-117
16.3
16.3
-0.9
3.6
102.4
102.5
31.8
VAL-117
LYS-118
12.6
12.5
7.7
-9.2
147.2
147.8
-17.7
LYS-118
ALA-119
10.3
10.2
-11.5
10.3
63.0
72.0
4.8
ALA-119
ALA-120
8.9
8.8
1.5
-1.3
134.9
136.0
38.1
ALA-120
CYS-121
5.5
5.5
0.5
1.3
98.9
96.5
-8.4

Graph shows rotational transition at bending residues and can be used
to identify hinge bending residues.
Probably only informative for interdomain rotations greater than 20 degrees
Residue
iResidue
i+1Distance of hinge axis to residue i in
(A) Distance of hinge axis to residue i in
(A) Change in
(deg) Change in
(deg) Angle of psi(i) axis to hinge axis
(deg) Angle of psi(i) axis to hinge axis
(deg) Percentage Progress
GLU-239
ARG-240
16.1
16.1
5.3
-7.7
76.3
75.9
-40.4
ARG-240
LEU-241
16.2
16.2
7.7
-12.5
129.9
130.6
14.8
LEU-241
VAL-242
14.3
14.1
-15.2
-4.5
21.6
33.4
264.3
VAL-242
GLU-243
15.1
14.7
-10.0
-7.7
77.0
83.8
67.8
GLU-243
PHE-244
18.4
18.2
21.4
-7.1
156.5
159.1
-178.8
PHE-244
GLY-245
19.6
19.5
6.0
-10.7
122.1
116.7
8.6

Graph shows rotational transition at bending residues and can be used
to identify hinge bending residues.
Probably only informative for interdomain rotations greater than 20 degrees
Residue
iResidue
i+1Distance of hinge axis to residue i in
(A) Distance of hinge axis to residue i in
(A) Change in
(deg) Change in
(deg) Angle of psi(i) axis to hinge axis
(deg) Angle of psi(i) axis to hinge axis
(deg) Percentage Progress
VAL-250
LYS-251
22.3
22.2
-8.8
5.9
66.3
61.3
-16.1
LYS-251
MET-252
19.8
19.6
9.2
2.0
141.7
140.1
-127.9
MET-252
ASP-253
19.6
19.7
1.4
6.1
107.1
108.0
-59.6
ASP-253
VAL-254
17.3
17.9
-8.6
1.8
8.8
13.3
79.4
VAL-254
TYR-255
15.5
15.9
18.0
-12.3
100.1
99.5
-10.9
TYR-255
ASN-256
15.6
15.9
3.2
-22.6
148.3
138.3
214.1
ASN-256
LEU-257
13.2
13.5
19.2
-30.2
113.7
105.6
1.8
LEU-257
GLY-258
15.6
15.4
6.7
1.2
99.6
98.7
-49.4
GLY-258
ASP-259
13.7
13.6
-1.1
1.0
26.3
26.8
-4.4

Graph shows rotational transition at bending residues and can be used
to identify hinge bending residues.
Probably only informative for interdomain rotations greater than 20 degrees