Mono-Adp-Ribosyltransferase C3
(All numbering and residues are taken from first PDB file)
![]()
![]()
Bending Residue Dihedral Analysis
Residue
iResidue
i+1Distance of hinge axis to residue i in
(A) Distance of hinge axis to residue i in
(A) Change in
(deg) Change in
(deg) Angle of psi(i) axis to hinge axis
(deg) Angle of psi(i) axis to hinge axis
(deg) Percentage Progress
ASN-51
VAL-52
8.2
8.2
23.7
-0.9
90.2
90.0
-31.4
VAL-52
GLU-53
4.5
4.5
2.4
-1.0
104.2
104.0
7.4
GLU-53
GLU-54
5.3
5.6
0.4
-3.6
41.7
40.6
-19.4
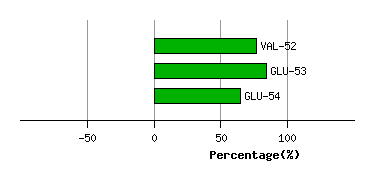
Graph shows rotational transition at bending residues and can be used
to identify hinge bending residues.
Probably only informative for interdomain rotations greater than 20 degrees
Residue
iResidue
i+1Distance of hinge axis to residue i in
(A) Distance of hinge axis to residue i in
(A) Change in
(deg) Change in
(deg) Angle of psi(i) axis to hinge axis
(deg) Angle of psi(i) axis to hinge axis
(deg) Percentage Progress
SER-116
LYS-117
14.3
13.9
3.4
8.6
46.3
41.1
87.4
LYS-117
MET-118
14.2
14.1
-6.0
3.0
111.6
112.6
-58.0
MET-118
LYS-119
10.5
10.4
-6.9
3.0
48.8
47.8
52.8

Graph shows rotational transition at bending residues and can be used
to identify hinge bending residues.
Probably only informative for interdomain rotations greater than 20 degrees
Residue
iResidue
i+1Distance of hinge axis to residue i in
(A) Distance of hinge axis to residue i in
(A) Change in
(deg) Change in
(deg) Angle of psi(i) axis to hinge axis
(deg) Angle of psi(i) axis to hinge axis
(deg) Percentage Progress
MET-120
PRO-121
7.4
7.6
-4.4
5.5
92.9
89.8
63.8
PRO-121
GLN-122
10.7
10.9
-1.7
0.4
99.0
99.5
-16.8
GLN-122
ASN-123
10.5
10.6
-2.3
-1.4
111.8
112.8
38.7
ASN-123
ILE-124
9.3
9.4
1.3
4.4
144.8
144.6
-105.2

Graph shows rotational transition at bending residues and can be used
to identify hinge bending residues.
Probably only informative for interdomain rotations greater than 20 degrees
Residue
iResidue
i+1Distance of hinge axis to residue i in
(A) Distance of hinge axis to residue i in
(A) Change in
(deg) Change in
(deg) Angle of psi(i) axis to hinge axis
(deg) Angle of psi(i) axis to hinge axis
(deg) Percentage Progress
LYS-165
ASP-166
11.6
11.3
2.0
-5.8
122.7
126.9
20.0
ASP-166
ARG-167
8.4
8.2
-12.9
12.6
73.1
75.9
31.3
ARG-167
THR-168
9.2
9.4
-10.5
2.1
75.1
69.3
-17.4
THR-168
GLU-169
8.5
8.8
1.2
-6.5
130.0
118.0
205.9
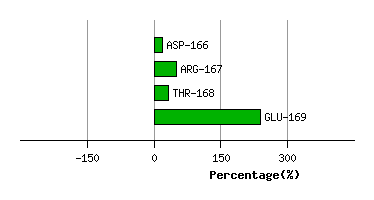
Graph shows rotational transition at bending residues and can be used
to identify hinge bending residues.
Probably only informative for interdomain rotations greater than 20 degrees
Residue
iResidue
i+1Distance of hinge axis to residue i in
(A) Distance of hinge axis to residue i in
(A) Change in
(deg) Change in
(deg) Angle of psi(i) axis to hinge axis
(deg) Angle of psi(i) axis to hinge axis
(deg) Percentage Progress
TYR-172
ILE-173
10.2
10.1
3.7
1.4
69.4
67.8
39.3
ILE-173
SER-174
7.7
7.6
9.9
-12.7
20.3
18.4
-41.6
SER-174
THR-175
7.7
7.6
-7.7
7.6
101.5
104.6
43.3
THR-175
SER-176
5.3
5.2
-1.4
0.6
159.8
160.2
-19.9
SER-176
LEU-177
4.1
4.0
-1.4
1.8
85.7
86.0
-33.6
LEU-177
MET-178
3.1
3.1
-0.7
6.8
108.8
111.4
100.8

Graph shows rotational transition at bending residues and can be used
to identify hinge bending residues.
Probably only informative for interdomain rotations greater than 20 degrees
Residue
iResidue
i+1Distance of hinge axis to residue i in
(A) Distance of hinge axis to residue i in
(A) Change in
(deg) Change in
(deg) Angle of psi(i) axis to hinge axis
(deg) Angle of psi(i) axis to hinge axis
(deg) Percentage Progress
LYS-198
GLY-199
6.6
6.4
-3.9
-0.9
47.7
43.7
78.7
GLY-199
GLY-200
5.5
5.5
2.6
-8.0
150.7
149.8
134.3
GLY-200
TYR-201
6.6
6.4
4.9
1.3
143.4
144.5
-183.2

Graph shows rotational transition at bending residues and can be used
to identify hinge bending residues.
Probably only informative for interdomain rotations greater than 20 degrees
Residue
iResidue
i+1Distance of hinge axis to residue i in
(A) Distance of hinge axis to residue i in
(A) Change in
(deg) Change in
(deg) Angle of psi(i) axis to hinge axis
(deg) Angle of psi(i) axis to hinge axis
(deg) Percentage Progress
PRO-209
GLY-210
7.9
7.9
-0.9
-3.3
110.0
108.8
39.8
GLY-210
GLN-211
5.2
5.1
3.9
1.5
140.2
141.3
-47.5
GLN-211
LEU-212
6.1
6.2
-2.1
1.4
56.8
58.3
-8.5
LEU-212
GLU-213
2.7
2.7
1.2
-1.8
170.0
171.9
-8.6
GLU-213
VAL-214
4.4
4.4
4.3
-4.3
125.2
124.5
45.8
GLU-213
VAL-214
4.4
4.4
4.3
-4.3
125.2
124.5
45.8

Graph shows rotational transition at bending residues and can be used
to identify hinge bending residues.
Probably only informative for interdomain rotations greater than 20 degrees
Residue
iResidue
i+1Distance of hinge axis to residue i in
(A) Distance of hinge axis to residue i in
(A) Change in
(deg) Change in
(deg) Angle of psi(i) axis to hinge axis
(deg) Angle of psi(i) axis to hinge axis
(deg) Percentage Progress
GLU-213
VAL-214
4.4
4.4
4.3
-4.3
125.2
124.5
45.8
GLU-213
VAL-214
4.4
4.4
4.3
-4.3
125.2
124.5
45.8
VAL-214
LEU-215
3.2
3.2
-0.1
1.5
42.9
41.9
-51.3
LEU-215
LEU-216
6.0
5.9
3.9
-7.9
150.3
150.2
85.6
LEU-216
PRO-217
5.1
5.1
6.0
7.1
124.0
126.5
-149.6
PRO-217
ARG-218
7.7
7.6
3.4
-3.9
119.6
111.8
-45.3
ARG-218
ASN-219
9.6
9.7
-2.5
-4.3
18.7
19.7
228.6

Graph shows rotational transition at bending residues and can be used
to identify hinge bending residues.
Probably only informative for interdomain rotations greater than 20 degrees
Residue
iResidue
i+1Distance of hinge axis to residue i in
(A) Distance of hinge axis to residue i in
(A) Change in
(deg) Change in
(deg) Angle of psi(i) axis to hinge axis
(deg) Angle of psi(i) axis to hinge axis
(deg) Percentage Progress
ILE-238
THR-239
14.4
14.2
-1.8
3.3
81.3
82.1
10.6
THR-239
ALA-240
12.2
11.9
1.1
3.0
37.2
39.7
95.6
ALA-240
MET-241
9.1
8.7
11.5
-10.4
88.8
91.4
66.8
MET-241
ILE-242
6.9
6.6
11.3
-51.3
69.3
69.9
-70.8
ILE-242
PHE-243
3.1
3.1
-1.8
24.5
131.7
94.1
344.5

Graph shows rotational transition at bending residues and can be used
to identify hinge bending residues.
Probably only informative for interdomain rotations greater than 20 degrees