Glutamate Receptor Ionotropic, Nmda 1
(All numbering and residues are taken from first PDB file)
![]()
![]()
Bending Residue Dihedral Analysis
Residue
iResidue
i+1Distance of hinge axis to residue i in
(A) Distance of hinge axis to residue i in
(A) Change in
(deg) Change in
(deg) Angle of psi(i) axis to hinge axis
(deg) Angle of psi(i) axis to hinge axis
(deg) Percentage Progress
PRO-140
PHE-141
13.5
13.7
-1.3
11.7
149.3
150.1
12.8
PHE-141
LYS-142
14.5
14.8
-4.9
-3.9
121.8
121.2
-14.4
LYS-142
TYR-143
11.1
11.3
4.7
37.1
134.3
131.3
-93.0
TYR-143
GLN-144
9.1
8.7
14.7
36.5
59.3
72.9
90.6
GLN-144
GLY-145
5.5
5.2
-64.5
10.1
47.0
70.7
120.0
GLY-145
LEU-146
2.2
2.3
-26.2
6.7
116.0
121.3
-22.7
LEU-146
THR-147
1.8
2.3
9.3
0.8
66.7
61.2
-9.8

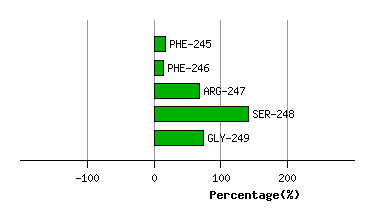
Graph shows rotational transition at bending residues and can be used
to identify hinge bending residues.
Probably only informative for interdomain rotations greater than 20 degrees
Residue
iResidue
i+1Distance of hinge axis to residue i in
(A) Distance of hinge axis to residue i in
(A) Change in
(deg) Change in
(deg) Angle of psi(i) axis to hinge axis
(deg) Angle of psi(i) axis to hinge axis
(deg) Percentage Progress
LEU-244
PHE-245
6.2
6.7
11.8
-6.8
9.9
13.6
16.8
PHE-245
PHE-246
4.8
5.5
-8.8
9.3
100.7
109.6
-3.3
PHE-246
ARG-247
1.5
2.7
-1.2
-21.0
58.5
67.1
54.0
ARG-247
SER-248
3.6
3.9
16.0
3.6
73.6
57.7
74.0
SER-248
GLY-249
4.9
5.4
52.0
-23.8
135.1
130.4
-69.0
Graph shows rotational transition at bending residues and can be used
to identify hinge bending residues.
Probably only informative for interdomain rotations greater than 20 degrees