Udp-N-Acetylglucosamine Pyrophosphorylase
(All numbering and residues are taken from first PDB file)
![]()
![]()
Bending Residue Dihedral Analysis
Residue
iResidue
i+1Distance of hinge axis to residue i in
(A) Distance of hinge axis to residue i in
(A) Change in
(deg) Change in
(deg) Angle of psi(i) axis to hinge axis
(deg) Angle of psi(i) axis to hinge axis
(deg) Percentage Progress
GLY-14
LYS-15
10.0
9.9
1.8
-22.4
167.0
157.3
300.3
LYS-15
GLY-16
10.6
10.8
38.0
-27.2
119.1
124.5
-81.6
GLY-16
THR-17
7.3
7.4
7.6
-7.1
158.9
157.5
-24.3

Graph shows rotational transition at bending residues and can be used
to identify hinge bending residues.
Probably only informative for interdomain rotations greater than 20 degrees
Residue
iResidue
i+1Distance of hinge axis to residue i in
(A) Distance of hinge axis to residue i in
(A) Change in
(deg) Change in
(deg) Angle of psi(i) axis to hinge axis
(deg) Angle of psi(i) axis to hinge axis
(deg) Percentage Progress
LYS-33
ALA-34
11.4
11.4
15.9
-11.7
94.8
94.9
-0.7
ALA-34
MET-35
8.5
8.6
1.6
-0.3
145.2
146.6
-18.2
MET-35
VAL-36
5.6
5.7
2.6
-2.3
146.3
144.1
-18.5
VAL-36
GLN-37
6.7
7.0
-3.2
-2.6
67.2
68.7
42.4
GLN-37
HIS-38
10.0
10.3
-1.2
0.9
51.7
53.1
18.1
HIS-38
VAL-39
8.9
9.2
-5.1
1.2
24.1
26.1
82.4

Graph shows rotational transition at bending residues and can be used
to identify hinge bending residues.
Probably only informative for interdomain rotations greater than 20 degrees
Residue
iResidue
i+1Distance of hinge axis to residue i in
(A) Distance of hinge axis to residue i in
(A) Change in
(deg) Change in
(deg) Angle of psi(i) axis to hinge axis
(deg) Angle of psi(i) axis to hinge axis
(deg) Percentage Progress
GLN-64
ALA-65
17.9
18.0
1.5
-10.1
82.0
81.0
16.8
ALA-65
LEU-66
15.1
15.2
10.5
-7.7
26.1
24.6
35.1
LEU-66
LYS-67
15.3
15.5
-6.3
5.2
112.3
112.3
14.9
LYS-67
ASP-68
19.1
19.3
0.4
2.9
50.8
52.9
-12.3
ASP-68
ASP-69
19.9
20.0
-6.0
0.4
154.1
157.6
-59.2
ASP-69
ASN-70
17.7
18.0
7.1
-11.1
55.6
61.5
-21.8

Graph shows rotational transition at bending residues and can be used
to identify hinge bending residues.
Probably only informative for interdomain rotations greater than 20 degrees
Residue
iResidue
i+1Distance of hinge axis to residue i in
(A) Distance of hinge axis to residue i in
(A) Change in
(deg) Change in
(deg) Angle of psi(i) axis to hinge axis
(deg) Angle of psi(i) axis to hinge axis
(deg) Percentage Progress
LEU-100
MET-101
5.0
5.0
1.9
-10.4
153.6
153.3
185.5
MET-101
LEU-102
4.7
4.8
-6.5
4.7
50.5
51.6
-108.7
LEU-102
TYR-103
3.0
3.0
6.1
-15.2
148.7
150.3
137.1
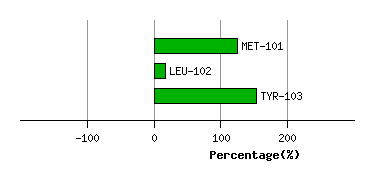
Graph shows rotational transition at bending residues and can be used
to identify hinge bending residues.
Probably only informative for interdomain rotations greater than 20 degrees
Residue
iResidue
i+1Distance of hinge axis to residue i in
(A) Distance of hinge axis to residue i in
(A) Change in
(deg) Change in
(deg) Angle of psi(i) axis to hinge axis
(deg) Angle of psi(i) axis to hinge axis
(deg) Percentage Progress
GLY-104
ASP-105
4.0
4.1
-11.2
8.0
134.8
131.4
-40.6
ASP-105
VAL-106
1.0
0.9
-0.6
0.4
69.9
64.6
21.9
VAL-106
PRO-107
2.1
2.1
-2.3
0.2
82.3
82.5
8.7
PRO-107
LEU-108
4.9
5.0
0.3
4.3
122.4
120.5
-17.0

Graph shows rotational transition at bending residues and can be used
to identify hinge bending residues.
Probably only informative for interdomain rotations greater than 20 degrees
Residue
iResidue
i+1Distance of hinge axis to residue i in
(A) Distance of hinge axis to residue i in
(A) Change in
(deg) Change in
(deg) Angle of psi(i) axis to hinge axis
(deg) Angle of psi(i) axis to hinge axis
(deg) Percentage Progress
VAL-226
ASN-227
3.7
3.8
-10.1
13.0
67.7
67.4
-33.9
ASN-227
ASN-228
5.3
5.5
-7.5
5.2
5.1
5.8
48.2
ASN-228
ARG-229
5.0
5.2
7.2
-10.2
98.9
101.4
34.2

Graph shows rotational transition at bending residues and can be used
to identify hinge bending residues.
Probably only informative for interdomain rotations greater than 20 degrees