Cyclohexanone Monooxygenase
(All numbering and residues are taken from first PDB file)
![]()
![]()
Bending Residue Dihedral Analysis
Residue
iResidue
i+1Distance of hinge axis to residue i in
(A) Distance of hinge axis to residue i in
(A) Change in
(deg) Change in
(deg) Angle of psi(i) axis to hinge axis
(deg) Angle of psi(i) axis to hinge axis
(deg) Percentage Progress
THR-47
TRP-48
13.5
12.9
-10.0
-13.1
72.3
67.8
-52.6
TRP-48
TYR-49
10.2
9.9
5.9
-1.9
127.5
127.3
9.9
TYR-49
TRP-50
12.2
12.0
-6.3
-4.3
130.6
136.1
-75.8

Graph shows rotational transition at bending residues and can be used
to identify hinge bending residues.
Probably only informative for interdomain rotations greater than 20 degrees
Residue
iResidue
i+1Distance of hinge axis to residue i in
(A) Distance of hinge axis to residue i in
(A) Change in
(deg) Change in
(deg) Angle of psi(i) axis to hinge axis
(deg) Angle of psi(i) axis to hinge axis
(deg) Percentage Progress
ARG-52
TYR-53
9.1
9.3
0.0
-5.5
126.1
132.0
29.6
TYR-53
PRO-54
8.7
9.0
-2.4
-1.2
94.8
93.0
20.6
PRO-54
GLY-55
6.9
7.2
-3.9
9.2
51.1
51.9
-33.7
GLY-55
ALA-56
3.4
3.6
-6.1
1.6
90.9
84.6
-7.1
GLY-55
ALA-56
3.4
3.6
-6.1
1.6
90.9
84.6
-7.1

Graph shows rotational transition at bending residues and can be used
to identify hinge bending residues.
Probably only informative for interdomain rotations greater than 20 degrees
Residue
iResidue
i+1Distance of hinge axis to residue i in
(A) Distance of hinge axis to residue i in
(A) Change in
(deg) Change in
(deg) Angle of psi(i) axis to hinge axis
(deg) Angle of psi(i) axis to hinge axis
(deg) Percentage Progress
GLY-55
ALA-56
3.4
3.6
-6.1
1.6
90.9
84.6
-7.1
GLY-55
ALA-56
3.4
3.6
-6.1
1.6
90.9
84.6
-7.1
ALA-56
LEU-57
3.7
3.9
-5.5
5.0
67.8
64.8
-76.3
LEU-57
SER-58
2.9
3.0
2.2
-3.8
72.3
69.7
43.8
SER-58
ASP-59
6.6
6.7
-7.7
-10.2
144.7
135.5
-182.2

Graph shows rotational transition at bending residues and can be used
to identify hinge bending residues.
Probably only informative for interdomain rotations greater than 20 degrees
Residue
iResidue
i+1Distance of hinge axis to residue i in
(A) Distance of hinge axis to residue i in
(A) Change in
(deg) Change in
(deg) Angle of psi(i) axis to hinge axis
(deg) Angle of psi(i) axis to hinge axis
(deg) Percentage Progress
ALA-142
VAL-143
23.6
23.7
-3.2
-4.8
105.9
110.3
119.2
VAL-143
GLY-144
23.0
23.1
1.5
31.3
50.1
49.2
177.2
GLY-144
LEU-145
20.1
20.2
-67.4
27.7
147.5
165.8
-632.9
LEU-145
LEU-146
19.4
20.2
-0.1
-67.5
91.8
118.8
-104.1
LEU-146
SER-147
18.5
17.2
-9.9
-65.1
89.3
51.1
523.0
SER-147
ALA-148
21.9
18.2
140.6
-26.3
83.2
71.6
563.5
ALA-148
ILE-149
22.9
21.0
-37.8
15.9
118.9
130.9
-265.9
ILE-149
ASN-150
20.2
19.4
14.6
-25.4
23.1
27.9
-227.3
ASN-150
PHE-151
19.9
19.7
17.8
-13.9
82.4
82.3
17.7
PHE-151
PRO-152
20.7
20.5
6.3
-3.7
36.4
37.8
-202.1
PRO-152
ASN-153
21.3
21.6
-17.5
13.3
99.5
89.6
-124.6
ASN-153
LEU-154
24.5
24.6
23.4
9.0
41.9
29.0
324.0
LEU-154
PRO-155
23.7
23.6
13.6
-0.6
90.6
79.9
-67.1
PRO-155
GLY-156
27.0
26.6
-0.3
-0.2
60.1
61.5
33.3

Graph shows rotational transition at bending residues and can be used
to identify hinge bending residues.
Probably only informative for interdomain rotations greater than 20 degrees
Residue
iResidue
i+1Distance of hinge axis to residue i in
(A) Distance of hinge axis to residue i in
(A) Change in
(deg) Change in
(deg) Angle of psi(i) axis to hinge axis
(deg) Angle of psi(i) axis to hinge axis
(deg) Percentage Progress
THR-186
GLY-187
7.0
7.1
7.5
-9.4
78.9
81.4
-1.0
GLY-187
SER-188
7.6
7.7
10.2
-1.2
45.0
44.1
43.0
SER-188
THR-189
5.9
6.3
4.8
-4.6
53.1
53.6
44.2
THR-189
GLY-190
6.9
7.1
-0.9
6.0
112.5
114.1
49.4
THR-189
GLY-190
6.9
7.1
-0.9
6.0
112.5
114.1
49.4
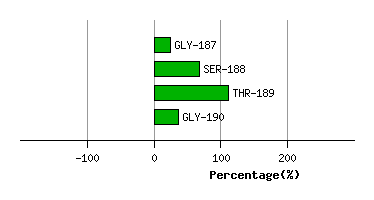
Graph shows rotational transition at bending residues and can be used
to identify hinge bending residues.
Probably only informative for interdomain rotations greater than 20 degrees
Residue
iResidue
i+1Distance of hinge axis to residue i in
(A) Distance of hinge axis to residue i in
(A) Change in
(deg) Change in
(deg) Angle of psi(i) axis to hinge axis
(deg) Angle of psi(i) axis to hinge axis
(deg) Percentage Progress
THR-189
GLY-190
6.9
7.1
-0.9
6.0
112.5
114.1
49.4
THR-189
GLY-190
6.9
7.1
-0.9
6.0
112.5
114.1
49.4
GLY-190
GLN-191
7.2
7.0
3.2
-7.1
83.0
89.2
51.9
GLN-191
GLN-192
3.6
3.4
3.7
-4.5
150.6
150.6
-4.5

Graph shows rotational transition at bending residues and can be used
to identify hinge bending residues.
Probably only informative for interdomain rotations greater than 20 degrees
Residue
iResidue
i+1Distance of hinge axis to residue i in
(A) Distance of hinge axis to residue i in
(A) Change in
(deg) Change in
(deg) Angle of psi(i) axis to hinge axis
(deg) Angle of psi(i) axis to hinge axis
(deg) Percentage Progress
SER-214
VAL-215
4.9
5.0
1.3
4.9
86.4
85.6
62.5
VAL-215
PRO-216
7.6
7.6
3.0
-0.3
28.8
28.6
9.7
PRO-216
VAL-217
8.2
8.1
4.2
6.6
40.2
40.5
84.6

Graph shows rotational transition at bending residues and can be used
to identify hinge bending residues.
Probably only informative for interdomain rotations greater than 20 degrees
Residue
iResidue
i+1Distance of hinge axis to residue i in
(A) Distance of hinge axis to residue i in
(A) Change in
(deg) Change in
(deg) Angle of psi(i) axis to hinge axis
(deg) Angle of psi(i) axis to hinge axis
(deg) Percentage Progress
ILE-303
ARG-304
8.7
8.4
-1.8
8.7
125.6
123.2
75.5
ARG-304
ALA-305
6.6
6.2
0.2
-7.2
79.5
80.4
-19.5
ALA-305
LYS-306
9.5
9.0
3.4
-0.9
142.1
140.5
8.8

Graph shows rotational transition at bending residues and can be used
to identify hinge bending residues.
Probably only informative for interdomain rotations greater than 20 degrees
Residue
iResidue
i+1Distance of hinge axis to residue i in
(A) Distance of hinge axis to residue i in
(A) Change in
(deg) Change in
(deg) Angle of psi(i) axis to hinge axis
(deg) Angle of psi(i) axis to hinge axis
(deg) Percentage Progress
LEU-320
MET-321
3.2
3.5
-0.8
8.5
76.3
78.5
103.0
MET-321
PRO-322
0.3
0.5
2.7
-6.6
83.2
82.5
30.1
PRO-322
LYS-323
3.4
3.1
-5.3
3.8
34.9
37.2
0.5

Graph shows rotational transition at bending residues and can be used
to identify hinge bending residues.
Probably only informative for interdomain rotations greater than 20 degrees
Residue
iResidue
i+1Distance of hinge axis to residue i in
(A) Distance of hinge axis to residue i in
(A) Change in
(deg) Change in
(deg) Angle of psi(i) axis to hinge axis
(deg) Angle of psi(i) axis to hinge axis
(deg) Percentage Progress
LEU-331
CYS-332
6.7
7.1
7.1
-12.9
99.4
100.5
9.5
CYS-332
ASP-333
5.7
5.8
0.0
-1.6
65.5
66.5
55.0
ASP-333
SER-334
3.3
3.4
5.0
1.1
113.6
111.7
-2.0

Graph shows rotational transition at bending residues and can be used
to identify hinge bending residues.
Probably only informative for interdomain rotations greater than 20 degrees
Residue
iResidue
i+1Distance of hinge axis to residue i in
(A) Distance of hinge axis to residue i in
(A) Change in
(deg) Change in
(deg) Angle of psi(i) axis to hinge axis
(deg) Angle of psi(i) axis to hinge axis
(deg) Percentage Progress
THR-380
GLY-381
14.2
14.5
-6.6
15.6
109.0
106.2
-11.1
GLY-381
PHE-382
14.6
14.6
5.1
-16.0
76.8
66.6
-82.2
PHE-382
ASP-383
18.1
17.8
-19.1
28.1
43.5
54.8
-102.6
ASP-383
ALA-384
21.2
21.2
-15.0
-172.8
110.9
124.3
-575.4
ALA-384
VAL-385
22.4
20.3
-35.7
-146.3
128.4
98.2
1530.7
VAL-385
ASP-386
21.9
22.7
-36.9
-3.9
127.8
104.7
-377.5
ASP-386
GLY-387
25.5
25.9
-18.2
-4.8
109.7
106.0
-137.6
GLY-387
ASN-388
25.3
24.8
-7.7
-2.1
161.5
148.8
-98.1
ASN-388
TYR-389
25.5
25.3
13.5
-8.6
75.4
72.8
-13.5

Graph shows rotational transition at bending residues and can be used
to identify hinge bending residues.
Probably only informative for interdomain rotations greater than 20 degrees