Glutamate Receptor Ionotropic, Delta-2
(All numbering and residues are taken from first PDB file)
![]()
![]()
Bending Residue Dihedral Analysis
Residue
iResidue
i+1Distance of hinge axis to residue i in
(A) Distance of hinge axis to residue i in
(A) Change in
(deg) Change in
(deg) Angle of psi(i) axis to hinge axis
(deg) Angle of psi(i) axis to hinge axis
(deg) Percentage Progress
ASP-104
TYR-105
4.9
5.6
20.0
-56.5
107.9
119.1
51.9
TYR-105
SER-106
3.4
3.9
3.5
3.0
74.1
49.5
36.4
SER-106
VAL-107
1.8
3.0
19.5
20.4
111.8
123.3
-80.5
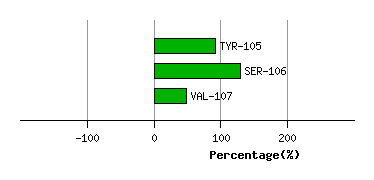
Graph shows rotational transition at bending residues and can be used
to identify hinge bending residues.
Probably only informative for interdomain rotations greater than 20 degrees
Residue
iResidue
i+1Distance of hinge axis to residue i in
(A) Distance of hinge axis to residue i in
(A) Change in
(deg) Change in
(deg) Angle of psi(i) axis to hinge axis
(deg) Angle of psi(i) axis to hinge axis
(deg) Percentage Progress
ASP-194
ALA-195
4.6
5.3
-6.7
9.4
98.5
93.8
53.0
ALA-195
ALA-196
4.3
3.8
-5.4
7.6
131.9
136.2
0.4
ALA-196
VAL-197
2.4
1.1
-1.6
-7.5
161.4
157.1
-40.4
VAL-197
LEU-198
2.6
2.9
-1.2
3.9
77.7
86.5
-16.1
VAL-197
LEU-198
2.6
2.9
-1.2
3.9
77.7
86.5
-16.1

Graph shows rotational transition at bending residues and can be used
to identify hinge bending residues.
Probably only informative for interdomain rotations greater than 20 degrees
Residue
iResidue
i+1Distance of hinge axis to residue i in
(A) Distance of hinge axis to residue i in
(A) Change in
(deg) Change in
(deg) Angle of psi(i) axis to hinge axis
(deg) Angle of psi(i) axis to hinge axis
(deg) Percentage Progress
VAL-197
LEU-198
2.6
2.9
-1.2
3.9
77.7
86.5
-16.1
VAL-197
LEU-198
2.6
2.9
-1.2
3.9
77.7
86.5
-16.1
LEU-198
GLU-199
6.3
6.1
-4.5
5.6
85.2
88.8
1.9
GLU-199
TYR-200
7.1
6.1
-3.2
-1.3
23.3
21.5
20.4

Graph shows rotational transition at bending residues and can be used
to identify hinge bending residues.
Probably only informative for interdomain rotations greater than 20 degrees
Residue
iResidue
i+1Distance of hinge axis to residue i in
(A) Distance of hinge axis to residue i in
(A) Change in
(deg) Change in
(deg) Angle of psi(i) axis to hinge axis
(deg) Angle of psi(i) axis to hinge axis
(deg) Percentage Progress
THR-212
VAL-213
11.7
11.2
10.1
0.3
157.5
167.5
-12.3
VAL-213
GLY-214
11.0
11.1
6.7
-28.7
105.9
108.6
61.5

Graph shows rotational transition at bending residues and can be used
to identify hinge bending residues.
Probably only informative for interdomain rotations greater than 20 degrees