Cyclohexadienyl Dehydratase
(All numbering and residues are taken from first PDB file)
![]()
![]()
Bending Residue Dihedral Analysis
Residue
iResidue
i+1Distance of hinge axis to residue i in
(A) Distance of hinge axis to residue i in
(A) Change in
(deg) Change in
(deg) Angle of psi(i) axis to hinge axis
(deg) Angle of psi(i) axis to hinge axis
(deg) Percentage Progress
LYS-108
TYR-109
2.3
2.6
4.6
-6.9
88.9
83.0
-16.2
TYR-109
GLY-110
2.6
2.6
10.2
10.0
33.5
34.4
152.9
GLY-110
THR-111
5.2
5.1
6.6
-12.4
89.7
91.8
-32.3
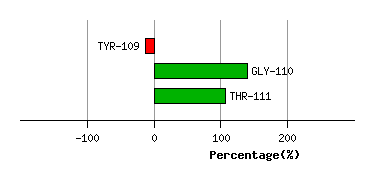
Graph shows rotational transition at bending residues and can be used
to identify hinge bending residues.
Probably only informative for interdomain rotations greater than 20 degrees
Residue
iResidue
i+1Distance of hinge axis to residue i in
(A) Distance of hinge axis to residue i in
(A) Change in
(deg) Change in
(deg) Angle of psi(i) axis to hinge axis
(deg) Angle of psi(i) axis to hinge axis
(deg) Percentage Progress
LYS-203
ASN-204
6.6
6.6
-0.9
1.8
138.5
136.0
45.9
ASN-204
PRO-205
7.8
7.9
-2.7
10.7
135.7
138.5
31.3
PRO-205
ALA-206
4.9
5.3
-4.5
4.7
127.4
130.5
44.5

Graph shows rotational transition at bending residues and can be used
to identify hinge bending residues.
Probably only informative for interdomain rotations greater than 20 degrees
Residue
iResidue
i+1Distance of hinge axis to residue i in
(A) Distance of hinge axis to residue i in
(A) Change in
(deg) Change in
(deg) Angle of psi(i) axis to hinge axis
(deg) Angle of psi(i) axis to hinge axis
(deg) Percentage Progress
LYS-230
LYS-231
14.9
14.3
18.0
-12.6
36.5
41.6
-5.7
LYS-231
SER-232
14.1
13.4
-14.4
2.9
103.5
97.3
-31.8
SER-232
SER-233
17.7
17.0
-18.9
34.4
62.6
47.8
-175.8
SER-233
GLY-234
17.4
17.3
-24.0
18.5
93.2
87.1
59.0
GLY-234
PHE-235
14.1
14.6
-17.9
-3.9
40.7
48.0
171.2
PHE-235
PHE-236
12.3
12.3
3.5
4.5
79.3
67.2
-60.9
PHE-236
ASN-237
8.8
9.3
3.3
6.0
61.8
65.9
24.6
ASN-237
LYS-238
9.3
10.4
-8.2
12.8
46.8
41.3
-94.3
LYS-238
LEU-239
11.0
11.0
-14.1
6.0
50.5
73.9
67.6
LEU-239
LEU-240
7.9
7.4
-3.5
4.3
116.1
129.9
35.6
LEU-240
ALA-241
6.0
6.3
-0.3
-3.3
86.7
85.6
-13.4
ALA-241
LYS-242
9.4
9.4
-3.7
-8.5
23.6
33.0
58.5
LYS-242
TYR-243
9.3
8.9
-2.2
6.9
86.7
92.4
1.7

Graph shows rotational transition at bending residues and can be used
to identify hinge bending residues.
Probably only informative for interdomain rotations greater than 20 degrees
Residue
iResidue
i+1Distance of hinge axis to residue i in
(A) Distance of hinge axis to residue i in
(A) Change in
(deg) Change in
(deg) Angle of psi(i) axis to hinge axis
(deg) Angle of psi(i) axis to hinge axis
(deg) Percentage Progress
LEU-245
LYS-246
6.4
5.3
-29.1
33.6
42.7
34.5
-48.6
LYS-246
SER-247
6.0
5.7
-38.0
18.7
54.8
60.3
132.4
SER-247
LEU-248
3.7
3.2
0.7
-2.2
164.0
166.8
9.4
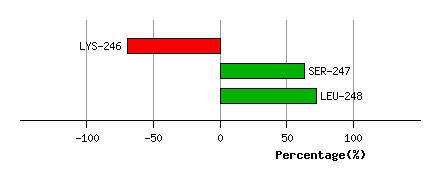
Graph shows rotational transition at bending residues and can be used
to identify hinge bending residues.
Probably only informative for interdomain rotations greater than 20 degrees