D-Glyceraldehyde-3-Phosphate Dehydrogenase 4 (E.C.1.2.1.12)
(All numbering and residues are taken from first PDB file)
![]()
![]()
Bending Residue Dihedral Analysis
Residue
iResidue
i+1Distance of hinge axis to residue i in
(A) Distance of hinge axis to residue i in
(A) Change in
(deg) Change in
(deg) Angle of psi(i) axis to hinge axis
(deg) Angle of psi(i) axis to hinge axis
(deg) Percentage Progress
VAL-30
ASN-31
12.1
12.1
1.1
-9.1
96.6
95.6
36.1
ASN-31
ASP-32
15.5
15.3
16.3
4.3
73.8
65.4
177.7
ASP-32
LEU-33
16.6
16.8
60.2
-43.3
125.1
107.0
-185.2
LEU-33
THR-34
19.9
20.1
41.0
-68.2
121.4
140.5
232.3
THR-34
ASP-36
18.5
19.3
56.1
-45.5
157.9
140.5
-123.6
ASP-36
ALA-37
18.1
17.7
11.1
9.9
93.7
92.4
47.1
ALA-37
ASN-38
14.6
14.1
-20.3
13.9
76.6
79.4
28.8

Graph shows rotational transition at bending residues and can be used
to identify hinge bending residues.
Probably only informative for interdomain rotations greater than 20 degrees
Residue
iResidue
i+1Distance of hinge axis to residue i in
(A) Distance of hinge axis to residue i in
(A) Change in
(deg) Change in
(deg) Angle of psi(i) axis to hinge axis
(deg) Angle of psi(i) axis to hinge axis
(deg) Percentage Progress
ASP-54
ALA-55
7.6
8.3
-15.5
9.6
110.5
117.5
-166.5
ALA-55
GLU-56
4.5
5.3
20.7
5.3
42.1
40.0
304.6
GLU-56
VAL-57
4.2
4.2
-7.4
-5.3
78.6
75.9
-89.1
VAL-57
SER-58
5.3
5.2
-4.2
0.5
139.9
140.1
21.3
SER-58
VAL-59
7.2
6.9
0.4
-2.0
99.7
100.0
-53.2
VAL-59
ASN-60
9.9
9.3
21.3
-31.3
33.7
35.4
-85.4

Graph shows rotational transition at bending residues and can be used
to identify hinge bending residues.
Probably only informative for interdomain rotations greater than 20 degrees
Residue
iResidue
i+1Distance of hinge axis to residue i in
(A) Distance of hinge axis to residue i in
(A) Change in
(deg) Change in
(deg) Angle of psi(i) axis to hinge axis
(deg) Angle of psi(i) axis to hinge axis
(deg) Percentage Progress
LEU-64
VAL-65
8.6
8.3
3.3
-8.6
65.6
65.6
120.9
VAL-65
VAL-66
5.3
5.0
-11.5
13.5
59.9
68.7
-70.8
VAL-66
ASN-67
2.3
1.8
12.3
-9.1
75.3
73.7
101.4
ASN-67
GLY-68
1.5
1.7
4.9
-12.6
53.1
60.8
-110.7
GLY-68
LYS-69
3.3
3.3
13.8
0.3
113.1
118.1
-72.3
LYS-69
GLU-70
5.9
5.5
17.4
-23.4
96.6
91.4
143.7
GLU-70
ILE-71
7.9
7.7
13.3
-21.2
151.8
151.4
142.5
ILE-71
ILE-72
9.1
9.0
6.6
-1.1
84.7
80.8
-118.4
ILE-72
VAL-73
12.8
12.7
0.4
4.1
133.7
125.8
-61.4

Graph shows rotational transition at bending residues and can be used
to identify hinge bending residues.
Probably only informative for interdomain rotations greater than 20 degrees
Residue
iResidue
i+1Distance of hinge axis to residue i in
(A) Distance of hinge axis to residue i in
(A) Change in
(deg) Change in
(deg) Angle of psi(i) axis to hinge axis
(deg) Angle of psi(i) axis to hinge axis
(deg) Percentage Progress
LEU-154
ALA-155
3.8
4.0
7.5
-5.9
75.3
71.4
11.9
ALA-155
PRO-156
1.2
0.9
4.8
2.2
94.2
92.5
33.3
PRO-156
PHE-157
4.7
4.4
-22.5
20.1
133.8
135.1
20.2
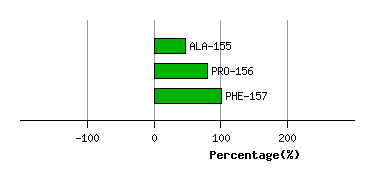
Graph shows rotational transition at bending residues and can be used
to identify hinge bending residues.
Probably only informative for interdomain rotations greater than 20 degrees
Residue
iResidue
i+1Distance of hinge axis to residue i in
(A) Distance of hinge axis to residue i in
(A) Change in
(deg) Change in
(deg) Angle of psi(i) axis to hinge axis
(deg) Angle of psi(i) axis to hinge axis
(deg) Percentage Progress
VAL-214
ALA-215
4.5
4.4
4.7
-6.3
122.9
124.7
126.6
ALA-215
LEU-216
6.7
6.5
2.0
-10.8
53.1
59.0
-60.7
LEU-216
VAL-217
8.9
8.8
5.4
-4.7
74.5
70.4
57.4
VAL-217
LEU-218
6.9
6.9
20.3
-15.0
39.7
43.2
92.6
VAL-217
LEU-218
6.9
6.9
20.3
-15.0
39.7
43.2
92.6

Graph shows rotational transition at bending residues and can be used
to identify hinge bending residues.
Probably only informative for interdomain rotations greater than 20 degrees
Residue
iResidue
i+1Distance of hinge axis to residue i in
(A) Distance of hinge axis to residue i in
(A) Change in
(deg) Change in
(deg) Angle of psi(i) axis to hinge axis
(deg) Angle of psi(i) axis to hinge axis
(deg) Percentage Progress
VAL-217
LEU-218
6.9
6.9
20.3
-15.0
39.7
43.2
92.6
VAL-217
LEU-218
6.9
6.9
20.3
-15.0
39.7
43.2
92.6
LEU-218
PRO-219
6.0
6.0
-11.5
13.0
138.6
145.2
101.5
PRO-219
GLU-220
8.3
8.3
-5.9
4.7
152.6
152.9
-53.0

Graph shows rotational transition at bending residues and can be used
to identify hinge bending residues.
Probably only informative for interdomain rotations greater than 20 degrees
Residue
iResidue
i+1Distance of hinge axis to residue i in
(A) Distance of hinge axis to residue i in
(A) Change in
(deg) Change in
(deg) Angle of psi(i) axis to hinge axis
(deg) Angle of psi(i) axis to hinge axis
(deg) Percentage Progress
THR-287
VAL-288
7.1
7.0
-17.9
9.3
31.8
28.1
18.8
VAL-288
SER-289
7.4
7.1
-2.6
-0.7
61.4
63.0
82.7
SER-289
SER-290
5.0
4.6
16.1
-18.7
131.8
135.1
-31.4
SER-290
THR-291
7.5
7.3
-4.8
5.2
97.9
90.9
21.7
THR-291
ILE-292
11.3
11.1
0.7
11.4
145.5
144.4
-146.4

Graph shows rotational transition at bending residues and can be used
to identify hinge bending residues.
Probably only informative for interdomain rotations greater than 20 degrees
Residue
iResidue
i+1Distance of hinge axis to residue i in
(A) Distance of hinge axis to residue i in
(A) Change in
(deg) Change in
(deg) Angle of psi(i) axis to hinge axis
(deg) Angle of psi(i) axis to hinge axis
(deg) Percentage Progress
TYR-317
SER-318
2.6
2.7
3.1
-0.3
37.0
37.6
13.7
SER-318
HIS-319
2.0
2.3
3.0
2.9
82.8
83.1
1.7
HIS-319
ARG-320
1.8
1.5
-6.1
1.3
50.2
49.5
69.1

Graph shows rotational transition at bending residues and can be used
to identify hinge bending residues.
Probably only informative for interdomain rotations greater than 20 degrees