Putative Iron Binding Protein
(All numbering and residues are taken from first PDB file)
![]()
![]()
Bending Residue Dihedral Analysis
Residue
iResidue
i+1Distance of hinge axis to residue i in
(A) Distance of hinge axis to residue i in
(A) Change in
(deg) Change in
(deg) Angle of psi(i) axis to hinge axis
(deg) Angle of psi(i) axis to hinge axis
(deg) Percentage Progress
SER-103
LEU-104
3.5
4.6
1.0
-4.0
60.7
64.2
14.5
LEU-104
ARG-105
0.4
0.8
18.1
-28.8
112.5
122.1
0.2
ARG-105
ASP-106
3.8
3.3
65.0
-42.5
75.2
67.5
70.2
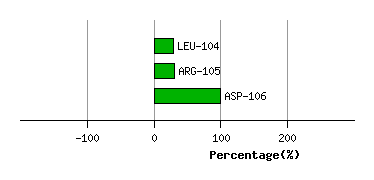
Graph shows rotational transition at bending residues and can be used
to identify hinge bending residues.
Probably only informative for interdomain rotations greater than 20 degrees
Residue
iResidue
i+1Distance of hinge axis to residue i in
(A) Distance of hinge axis to residue i in
(A) Change in
(deg) Change in
(deg) Angle of psi(i) axis to hinge axis
(deg) Angle of psi(i) axis to hinge axis
(deg) Percentage Progress
VAL-237
ASN-238
5.2
5.3
4.2
-26.5
138.0
134.9
79.7
ASN-238
ILE-239
3.5
3.5
-0.8
10.5
122.5
115.8
21.8
ILE-239
SER-240
2.1
2.8
1.1
0.7
87.9
84.5
-1.3
SER-240
GLY-241
5.4
6.2
-19.0
22.6
69.9
60.1
-21.6

Graph shows rotational transition at bending residues and can be used
to identify hinge bending residues.
Probably only informative for interdomain rotations greater than 20 degrees
Residue
iResidue
i+1Distance of hinge axis to residue i in
(A) Distance of hinge axis to residue i in
(A) Change in
(deg) Change in
(deg) Angle of psi(i) axis to hinge axis
(deg) Angle of psi(i) axis to hinge axis
(deg) Percentage Progress
GLN-267
THR-268
9.3
9.3
9.2
-6.4
143.5
149.7
17.9
THR-268
LEU-269
8.2
8.7
8.1
7.3
95.4
94.4
-14.2
LEU-269
TYR-270
9.5
9.5
1.0
0.7
39.7
55.1
-21.3
TYR-270
ALA-271
8.7
7.0
3.8
10.2
90.4
120.8
-11.3
ALA-271
GLN-272
5.0
4.2
-12.0
-41.5
40.3
39.7
125.0
GLN-272
ALA-273
5.4
5.5
15.3
-49.2
79.6
90.6
-47.2
ALA-273
ASN-274
8.7
8.5
9.3
17.2
69.9
43.2
63.7
ASN-274
TYR-275
7.9
7.6
-38.7
11.4
78.9
86.8
14.6
TYR-275
GLU-276
4.8
4.5
-6.9
-8.6
138.8
146.8
-48.1
GLU-276
TYR-277
2.8
2.8
8.9
-5.5
104.8
97.2
-31.5
TYR-277
PRO-278
1.0
1.5
3.9
-4.2
63.6
61.7
25.4

Graph shows rotational transition at bending residues and can be used
to identify hinge bending residues.
Probably only informative for interdomain rotations greater than 20 degrees
Residue
iResidue
i+1Distance of hinge axis to residue i in
(A) Distance of hinge axis to residue i in
(A) Change in
(deg) Change in
(deg) Angle of psi(i) axis to hinge axis
(deg) Angle of psi(i) axis to hinge axis
(deg) Percentage Progress
VAL-283
LYS-284
8.7
8.9
-6.1
-17.7
47.7
60.9
53.3
LYS-284
LEU-285
6.7
6.6
7.7
15.8
70.6
79.6
24.4
LEU-285
ASP-286
3.2
2.9
8.6
-10.9
138.3
146.6
10.0

Graph shows rotational transition at bending residues and can be used
to identify hinge bending residues.
Probably only informative for interdomain rotations greater than 20 degrees
Residue
iResidue
i+1Distance of hinge axis to residue i in
(A) Distance of hinge axis to residue i in
(A) Change in
(deg) Change in
(deg) Angle of psi(i) axis to hinge axis
(deg) Angle of psi(i) axis to hinge axis
(deg) Percentage Progress
PHE-292
GLY-293
9.4
9.4
3.0
6.0
104.2
108.5
2.3
GLY-293
PRO-294
10.9
10.7
-17.6
1.0
38.5
43.7
58.9
PRO-294
LEU-295
11.6
10.5
6.7
4.3
151.6
152.6
-58.0
LEU-295
LYS-296
9.8
9.3
0.1
1.7
133.1
134.8
-10.8
LYS-296
VAL-297
11.8
11.6
-10.6
10.4
41.6
31.4
-27.1

Graph shows rotational transition at bending residues and can be used
to identify hinge bending residues.
Probably only informative for interdomain rotations greater than 20 degrees