Endo-1,4-Beta-Xylanase A
(All numbering and residues are taken from first PDB file)
![]()
![]()
Bending Residue Dihedral Analysis
Residue
iResidue
i+1Distance of hinge axis to residue i in
(A) Distance of hinge axis to residue i in
(A) Change in
(deg) Change in
(deg) Angle of psi(i) axis to hinge axis
(deg) Angle of psi(i) axis to hinge axis
(deg) Percentage Progress
THR-3
ASP-4
11.3
11.3
4.9
9.3
162.2
155.1
-144.7
ASP-4
TYR-5
12.0
12.4
-4.1
-9.1
53.8
45.7
168.2
TYR-5
TRP-6
9.3
9.6
3.6
-3.6
81.0
79.5
-50.0
TRP-6
GLN-7
5.6
5.9
0.2
-6.7
113.0
117.7
70.0
GLN-7
ASN-8
5.4
5.6
-2.1
11.4
80.1
83.5
47.2
ASN-8
TRP-9
3.9
3.8
4.0
0.8
132.9
132.0
-28.3

Graph shows rotational transition at bending residues and can be used
to identify hinge bending residues.
Probably only informative for interdomain rotations greater than 20 degrees
Residue
iResidue
i+1Distance of hinge axis to residue i in
(A) Distance of hinge axis to residue i in
(A) Change in
(deg) Change in
(deg) Angle of psi(i) axis to hinge axis
(deg) Angle of psi(i) axis to hinge axis
(deg) Percentage Progress
VAL-19
ASN-20
5.2
5.0
-2.5
2.3
63.9
69.8
-77.4
ASN-20
GLY-21
5.0
4.8
-3.1
1.3
71.9
69.3
43.3
GLY-21
SER-22
8.0
7.6
-5.7
7.3
82.3
83.8
51.0
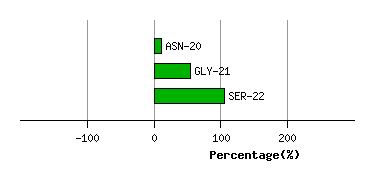
Graph shows rotational transition at bending residues and can be used
to identify hinge bending residues.
Probably only informative for interdomain rotations greater than 20 degrees
Residue
iResidue
i+1Distance of hinge axis to residue i in
(A) Distance of hinge axis to residue i in
(A) Change in
(deg) Change in
(deg) Angle of psi(i) axis to hinge axis
(deg) Angle of psi(i) axis to hinge axis
(deg) Percentage Progress
SER-27
VAL-28
5.0
4.9
-0.7
-0.6
48.1
47.7
23.9
VAL-28
ASN-29
6.2
6.1
4.2
0.7
76.7
77.2
3.5
ASN-29
TRP-30
9.9
9.9
-6.4
2.4
47.1
49.2
53.2
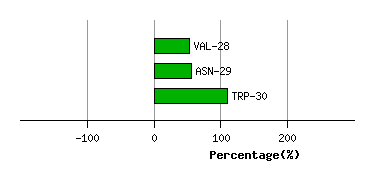
Graph shows rotational transition at bending residues and can be used
to identify hinge bending residues.
Probably only informative for interdomain rotations greater than 20 degrees
Residue
iResidue
i+1Distance of hinge axis to residue i in
(A) Distance of hinge axis to residue i in
(A) Change in
(deg) Change in
(deg) Angle of psi(i) axis to hinge axis
(deg) Angle of psi(i) axis to hinge axis
(deg) Percentage Progress
VAL-37
VAL-38
8.3
8.3
-4.8
-0.1
104.0
102.7
65.5
VAL-38
GLY-39
4.5
4.5
-11.1
3.7
39.5
37.2
93.0
GLY-39
LYS-40
3.6
3.8
0.4
2.1
75.3
75.5
19.6

Graph shows rotational transition at bending residues and can be used
to identify hinge bending residues.
Probably only informative for interdomain rotations greater than 20 degrees
Residue
iResidue
i+1Distance of hinge axis to residue i in
(A) Distance of hinge axis to residue i in
(A) Change in
(deg) Change in
(deg) Angle of psi(i) axis to hinge axis
(deg) Angle of psi(i) axis to hinge axis
(deg) Percentage Progress
VAL-57
TRP-58
7.3
7.4
-6.5
0.7
76.3
82.5
24.3
TRP-58
ALA-59
7.5
7.7
11.0
-4.9
86.9
85.8
82.3
ALA-59
PRO-60
11.1
11.3
-2.8
-16.9
43.0
47.8
201.3
PRO-60
ASN-61
12.5
12.5
24.4
-19.7
78.3
78.9
230.7
ASN-61
GLY-62
16.2
16.1
81.5
-40.9
115.7
123.2
-467.3

Graph shows rotational transition at bending residues and can be used
to identify hinge bending residues.
Probably only informative for interdomain rotations greater than 20 degrees
Residue
iResidue
i+1Distance of hinge axis to residue i in
(A) Distance of hinge axis to residue i in
(A) Change in
(deg) Change in
(deg) Angle of psi(i) axis to hinge axis
(deg) Angle of psi(i) axis to hinge axis
(deg) Percentage Progress
GLY-64
TYR-65
12.5
12.7
-31.1
-1.9
46.1
41.5
503.8
TYR-65
LEU-66
10.8
10.8
-1.4
6.9
90.0
90.8
-73.3
LEU-66
THR-67
7.3
7.4
-2.0
-0.8
75.3
74.4
5.3

Graph shows rotational transition at bending residues and can be used
to identify hinge bending residues.
Probably only informative for interdomain rotations greater than 20 degrees
Residue
iResidue
i+1Distance of hinge axis to residue i in
(A) Distance of hinge axis to residue i in
(A) Change in
(deg) Change in
(deg) Angle of psi(i) axis to hinge axis
(deg) Angle of psi(i) axis to hinge axis
(deg) Percentage Progress
MET-169
ALA-170
6.1
6.4
-0.1
-1.0
60.4
60.0
23.1
ALA-170
THR-171
5.7
5.7
1.9
8.7
67.1
67.4
160.2
THR-171
GLU-172
6.1
6.3
-1.3
-9.7
46.0
47.4
182.8

Graph shows rotational transition at bending residues and can be used
to identify hinge bending residues.
Probably only informative for interdomain rotations greater than 20 degrees
Residue
iResidue
i+1Distance of hinge axis to residue i in
(A) Distance of hinge axis to residue i in
(A) Change in
(deg) Change in
(deg) Angle of psi(i) axis to hinge axis
(deg) Angle of psi(i) axis to hinge axis
(deg) Percentage Progress
GLY-178
SER-179
12.9
12.8
11.3
1.6
78.1
76.6
-36.8
SER-179
SER-180
10.0
10.1
-9.0
0.1
50.7
52.2
150.5
SER-180
ASN-181
6.5
6.6
-1.0
-2.7
102.8
102.6
-16.9

Graph shows rotational transition at bending residues and can be used
to identify hinge bending residues.
Probably only informative for interdomain rotations greater than 20 degrees