Glucose-1-Phosphate Adenylyltransferase Small Subunit
(All numbering and residues are taken from first PDB file)
![]()
![]()
Bending Residue Dihedral Analysis
Residue
iResidue
i+1Distance of hinge axis to residue i in
(A) Distance of hinge axis to residue i in
(A) Change in
(deg) Change in
(deg) Angle of psi(i) axis to hinge axis
(deg) Angle of psi(i) axis to hinge axis
(deg) Percentage Progress
ALA-169
ALA-170
8.1
8.2
6.6
-13.9
74.8
75.3
2.1
ALA-170
LEU-171
4.7
4.6
17.9
-27.0
140.3
137.7
33.3
LEU-171
PRO-172
1.7
1.8
18.8
0.3
70.0
67.9
31.2
PRO-172
MET-173
3.4
3.2
-30.3
42.9
79.0
79.4
0.2

Graph shows rotational transition at bending residues and can be used
to identify hinge bending residues.
Probably only informative for interdomain rotations greater than 20 degrees
Residue
iResidue
i+1Distance of hinge axis to residue i in
(A) Distance of hinge axis to residue i in
(A) Change in
(deg) Change in
(deg) Angle of psi(i) axis to hinge axis
(deg) Angle of psi(i) axis to hinge axis
(deg) Percentage Progress
PHE-181
GLY-182
7.4
7.5
-24.3
13.2
28.0
25.2
51.5
GLY-182
LEU-183
5.9
6.1
33.3
-26.5
85.0
81.1
15.1
LEU-183
MET-184
2.6
2.6
-3.2
-11.0
51.2
49.8
64.6
MET-184
LYS-185
1.1
1.2
17.2
-13.6
102.0
94.4
29.1
LYS-185
ILE-186
3.6
4.1
7.9
-24.3
94.8
95.9
24.1
ILE-186
ASP-187
7.1
7.5
-25.5
41.6
53.3
74.0
-23.9
ASP-187
GLU-188
10.3
11.0
4.8
-14.9
52.2
35.9
-45.5
GLU-188
GLU-189
13.8
14.1
14.0
0.9
59.1
62.2
45.4
GLU-189
GLY-190
14.3
14.5
-9.9
9.8
127.6
119.5
-4.5
GLY-190
ARG-191
11.1
11.1
15.1
-4.9
116.8
125.8
-18.8
ARG-191
ILE-192
10.7
10.9
11.8
-13.5
108.5
105.3
20.3
ILE-192
ILE-193
7.2
7.4
-13.6
19.3
9.0
4.3
-26.3
ILE-193
GLU-194
6.0
6.5
-8.7
6.0
74.0
72.3
-1.4
GLU-194
PHE-195
2.5
2.8
-30.4
16.2
143.3
140.4
-67.1
PHE-195
ALA-196
3.0
3.3
-30.0
29.8
72.0
71.1
8.7

Graph shows rotational transition at bending residues and can be used
to identify hinge bending residues.
Probably only informative for interdomain rotations greater than 20 degrees
Residue
iResidue
i+1Distance of hinge axis to residue i in
(A) Distance of hinge axis to residue i in
(A) Change in
(deg) Change in
(deg) Angle of psi(i) axis to hinge axis
(deg) Angle of psi(i) axis to hinge axis
(deg) Percentage Progress
PHE-226
ILE-227
5.4
4.9
13.1
5.9
58.1
64.9
77.6
ILE-227
ALA-228
2.3
2.0
-21.8
11.0
74.0
81.5
26.4
ALA-228
SER-229
1.5
1.7
-15.4
2.3
103.6
105.2
-12.2
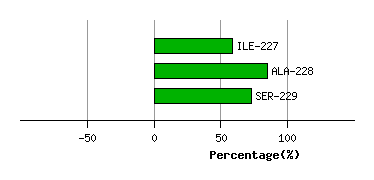
Graph shows rotational transition at bending residues and can be used
to identify hinge bending residues.
Probably only informative for interdomain rotations greater than 20 degrees