Actin, Cytoplasmic 1
(All numbering and residues are taken from first PDB file)
![]()
![]()
Bending Residue Dihedral Analysis
Residue
iResidue
i+1Distance of hinge axis to residue i in
(A) Distance of hinge axis to residue i in
(A) Change in
(deg) Change in
(deg) Angle of psi(i) axis to hinge axis
(deg) Angle of psi(i) axis to hinge axis
(deg) Percentage Progress
ALA-19
GLY-20
19.9
20.0
2.9
-13.0
173.2
169.1
163.1
GLY-20
PHE-21
18.8
19.1
9.2
-5.8
102.4
99.3
-106.0
PHE-21
ALA-22
17.3
17.3
-9.1
16.5
77.6
76.6
-97.6
ALA-22
GLY-23
13.5
13.7
-0.6
13.3
16.1
5.8
-277.5

Graph shows rotational transition at bending residues and can be used
to identify hinge bending residues.
Probably only informative for interdomain rotations greater than 20 degrees
Residue
iResidue
i+1Distance of hinge axis to residue i in
(A) Distance of hinge axis to residue i in
(A) Change in
(deg) Change in
(deg) Angle of psi(i) axis to hinge axis
(deg) Angle of psi(i) axis to hinge axis
(deg) Percentage Progress
PRO-102
VAL-103
17.7
17.8
-1.7
8.8
101.2
97.7
221.0
VAL-103
LEU-104
16.1
16.6
-18.1
5.2
117.0
113.1
-253.2
LEU-104
LEU-105
12.9
13.3
1.1
-16.3
58.4
59.1
44.5
LEU-105
THR-106
13.5
13.7
-4.3
8.1
99.5
105.6
37.3

Graph shows rotational transition at bending residues and can be used
to identify hinge bending residues.
Probably only informative for interdomain rotations greater than 20 degrees
Residue
iResidue
i+1Distance of hinge axis to residue i in
(A) Distance of hinge axis to residue i in
(A) Change in
(deg) Change in
(deg) Angle of psi(i) axis to hinge axis
(deg) Angle of psi(i) axis to hinge axis
(deg) Percentage Progress
GLU-107
ALA-108
11.2
11.5
-8.2
11.6
98.2
99.4
-91.1
ALA-108
PRO-109
11.3
11.5
-11.3
8.0
106.7
108.3
226.5
PRO-109
LEU-110
8.6
8.8
-9.9
2.9
166.4
169.5
-133.1
LEU-110
ASN-111
7.3
7.6
5.0
-5.8
73.3
69.2
-11.9
ASN-111
PRO-112
9.4
9.5
2.6
10.4
43.3
43.6
9.7
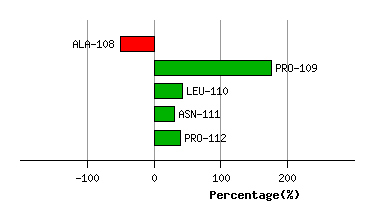
Graph shows rotational transition at bending residues and can be used
to identify hinge bending residues.
Probably only informative for interdomain rotations greater than 20 degrees
Residue
iResidue
i+1Distance of hinge axis to residue i in
(A) Distance of hinge axis to residue i in
(A) Change in
(deg) Change in
(deg) Angle of psi(i) axis to hinge axis
(deg) Angle of psi(i) axis to hinge axis
(deg) Percentage Progress
ALA-144
SER-145
9.0
8.8
2.3
5.1
115.4
116.9
-30.2
SER-145
GLY-146
10.2
10.1
0.2
25.8
116.4
115.8
-163.3
GLY-146
ARG-147
7.1
7.2
-33.1
12.2
115.5
121.8
154.4

Graph shows rotational transition at bending residues and can be used
to identify hinge bending residues.
Probably only informative for interdomain rotations greater than 20 degrees
Residue
iResidue
i+1Distance of hinge axis to residue i in
(A) Distance of hinge axis to residue i in
(A) Change in
(deg) Change in
(deg) Angle of psi(i) axis to hinge axis
(deg) Angle of psi(i) axis to hinge axis
(deg) Percentage Progress
THR-162
VAL-163
13.6
13.9
8.8
-10.8
94.2
93.2
26.8
VAL-163
PRO-164
9.9
10.4
6.4
-3.0
53.9
55.0
48.1
PRO-164
ILE-165
9.9
9.9
-12.9
5.3
105.9
105.3
-57.7
ILE-165
TYR-166
7.1
7.2
-1.0
-2.7
117.2
115.3
-37.6
TYR-166
GLU-167
7.5
7.4
-0.3
3.2
124.2
119.8
57.1
GLU-167
GLY-168
6.2
6.1
8.1
-0.6
97.8
94.5
-127.1
GLU-167
GLY-168
6.2
6.1
8.1
-0.6
97.8
94.5
-127.1

Graph shows rotational transition at bending residues and can be used
to identify hinge bending residues.
Probably only informative for interdomain rotations greater than 20 degrees
Residue
iResidue
i+1Distance of hinge axis to residue i in
(A) Distance of hinge axis to residue i in
(A) Change in
(deg) Change in
(deg) Angle of psi(i) axis to hinge axis
(deg) Angle of psi(i) axis to hinge axis
(deg) Percentage Progress
GLU-167
GLY-168
6.2
6.1
8.1
-0.6
97.8
94.5
-127.1
GLU-167
GLY-168
6.2
6.1
8.1
-0.6
97.8
94.5
-127.1
GLY-168
TYR-169
2.8
2.6
-14.5
-2.6
19.9
17.5
188.2
TYR-169
ALA-170
2.9
2.6
-0.6
3.4
56.6
56.4
-54.1

Graph shows rotational transition at bending residues and can be used
to identify hinge bending residues.
Probably only informative for interdomain rotations greater than 20 degrees
Residue
iResidue
i+1Distance of hinge axis to residue i in
(A) Distance of hinge axis to residue i in
(A) Change in
(deg) Change in
(deg) Angle of psi(i) axis to hinge axis
(deg) Angle of psi(i) axis to hinge axis
(deg) Percentage Progress
LEU-171
PRO-172
5.7
5.7
7.0
10.2
32.3
38.9
296.5
PRO-172
HIS-173
4.7
5.2
-13.1
13.0
135.7
134.0
-143.8
HIS-173
ALA-174
7.1
7.4
-20.7
17.9
75.9
76.5
160.9

Graph shows rotational transition at bending residues and can be used
to identify hinge bending residues.
Probably only informative for interdomain rotations greater than 20 degrees
Residue
iResidue
i+1Distance of hinge axis to residue i in
(A) Distance of hinge axis to residue i in
(A) Change in
(deg) Change in
(deg) Angle of psi(i) axis to hinge axis
(deg) Angle of psi(i) axis to hinge axis
(deg) Percentage Progress
LEU-349
SER-350
7.9
7.0
4.7
-20.9
102.8
96.8
171.6
SER-350
THR-351
10.8
9.6
26.7
-52.7
153.1
149.3
522.7
THR-351
PHE-352
9.4
8.5
20.1
-14.3
144.5
145.9
-208.0

Graph shows rotational transition at bending residues and can be used
to identify hinge bending residues.
Probably only informative for interdomain rotations greater than 20 degrees