Glutamate Receptor 2, Linker, Glutamate Receptor 2
(All numbering and residues are taken from first PDB file)
![]()
![]()
Bending Residue Dihedral Analysis
Residue
iResidue
i+1Distance of hinge axis to residue i in
(A) Distance of hinge axis to residue i in
(A) Change in
(deg) Change in
(deg) Angle of psi(i) axis to hinge axis
(deg) Angle of psi(i) axis to hinge axis
(deg) Percentage Progress
GLY-107
ILE-108
3.6
3.8
17.0
-9.2
40.4
39.0
71.2
ILE-108
SER-109
6.8
6.5
5.4
-4.1
64.8
66.8
-132.4
SER-109
ILE-110
6.6
6.4
20.7
-12.5
37.8
36.8
52.9
ILE-110
MET-111
8.8
8.4
8.0
-6.4
29.1
28.0
60.6
MET-111
ILE-112
7.9
7.6
-3.8
-24.9
125.1
123.0
-153.4
ILE-112
LYS-113
10.1
9.9
16.8
-9.3
24.1
37.9
170.4
LYS-113
LYS-114
10.1
10.3
11.6
-20.3
91.6
103.4
-3.7
LYS-114
GLY-115
10.4
10.9
34.0
-21.5
72.3
65.2
62.1

Graph shows rotational transition at bending residues and can be used
to identify hinge bending residues.
Probably only informative for interdomain rotations greater than 20 degrees
Residue
iResidue
i+1Distance of hinge axis to residue i in
(A) Distance of hinge axis to residue i in
(A) Change in
(deg) Change in
(deg) Angle of psi(i) axis to hinge axis
(deg) Angle of psi(i) axis to hinge axis
(deg) Percentage Progress
ARG-177
VAL-178
13.9
14.5
-1.0
-5.7
96.7
94.0
-19.9
VAL-178
ARG-179
11.7
11.9
4.2
-3.9
154.2
153.6
14.3
ARG-179
LYS-180
10.0
10.6
-4.0
-7.9
43.3
48.3
78.2

Graph shows rotational transition at bending residues and can be used
to identify hinge bending residues.
Probably only informative for interdomain rotations greater than 20 degrees
Residue
iResidue
i+1Distance of hinge axis to residue i in
(A) Distance of hinge axis to residue i in
(A) Change in
(deg) Change in
(deg) Angle of psi(i) axis to hinge axis
(deg) Angle of psi(i) axis to hinge axis
(deg) Percentage Progress
TYR-185
ALA-186
16.0
15.7
10.3
1.8
117.4
118.7
-49.2
ALA-186
TYR-187
13.5
13.3
-8.6
8.1
58.6
59.1
3.2
TYR-187
LEU-188
11.7
11.7
4.9
-4.1
149.0
147.8
14.4

Graph shows rotational transition at bending residues and can be used
to identify hinge bending residues.
Probably only informative for interdomain rotations greater than 20 degrees
Residue
iResidue
i+1Distance of hinge axis to residue i in
(A) Distance of hinge axis to residue i in
(A) Change in
(deg) Change in
(deg) Angle of psi(i) axis to hinge axis
(deg) Angle of psi(i) axis to hinge axis
(deg) Percentage Progress
LEU-189
GLU-190
8.7
8.9
3.9
12.3
56.9
64.3
56.5
GLU-190
SER-191
6.2
6.7
-11.5
1.7
60.7
61.5
30.7
SER-191
THR-192
2.5
2.9
-1.6
-4.4
58.3
57.3
60.9
THR-192
MET-193
3.9
4.1
12.1
-0.7
163.3
161.3
-109.6
MET-193
ASN-194
5.1
5.3
-0.6
-4.6
59.8
60.9
27.0
ASN-194
GLU-195
2.9
2.8
5.8
2.4
113.2
109.1
-25.5
ASN-194
GLU-195
2.9
2.8
5.8
2.4
113.2
109.1
-25.5

Graph shows rotational transition at bending residues and can be used
to identify hinge bending residues.
Probably only informative for interdomain rotations greater than 20 degrees
Residue
iResidue
i+1Distance of hinge axis to residue i in
(A) Distance of hinge axis to residue i in
(A) Change in
(deg) Change in
(deg) Angle of psi(i) axis to hinge axis
(deg) Angle of psi(i) axis to hinge axis
(deg) Percentage Progress
ASN-194
GLU-195
2.9
2.8
5.8
2.4
113.2
109.1
-25.5
ASN-194
GLU-195
2.9
2.8
5.8
2.4
113.2
109.1
-25.5
GLU-195
TYR-196
1.1
1.3
-3.8
-2.1
40.7
35.8
39.1
TYR-196
ILE-197
3.7
3.9
7.6
-4.7
149.7
147.6
-20.9

Graph shows rotational transition at bending residues and can be used
to identify hinge bending residues.
Probably only informative for interdomain rotations greater than 20 degrees
Residue
iResidue
i+1Distance of hinge axis to residue i in
(A) Distance of hinge axis to residue i in
(A) Change in
(deg) Change in
(deg) Angle of psi(i) axis to hinge axis
(deg) Angle of psi(i) axis to hinge axis
(deg) Percentage Progress
GLU-198
GLN-199
1.2
1.4
2.3
24.4
53.6
66.1
128.7
GLN-199
ARG-200
3.4
3.5
-32.9
4.8
143.0
160.7
-236.3
ARG-200
LYS-201
2.8
2.5
-155.7
-69.4
137.3
125.2
868.3

Graph shows rotational transition at bending residues and can be used
to identify hinge bending residues.
Probably only informative for interdomain rotations greater than 20 degrees
Residue
iResidue
i+1Distance of hinge axis to residue i in
(A) Distance of hinge axis to residue i in
(A) Change in
(deg) Change in
(deg) Angle of psi(i) axis to hinge axis
(deg) Angle of psi(i) axis to hinge axis
(deg) Percentage Progress
CYS-203
ASP-204
2.7
4.7
-55.3
27.9
96.3
92.9
-47.7
ASP-204
THR-205
5.6
6.6
-16.6
3.9
154.2
153.6
-70.6
THR-205
MET-206
5.7
6.1
-11.0
0.6
129.4
136.3
-97.3
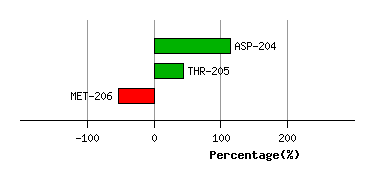
Graph shows rotational transition at bending residues and can be used
to identify hinge bending residues.
Probably only informative for interdomain rotations greater than 20 degrees
Residue
iResidue
i+1Distance of hinge axis to residue i in
(A) Distance of hinge axis to residue i in
(A) Change in
(deg) Change in
(deg) Angle of psi(i) axis to hinge axis
(deg) Angle of psi(i) axis to hinge axis
(deg) Percentage Progress
VAL-208
GLY-209
9.1
9.5
-23.7
-16.7
16.4
7.4
348.8
GLY-209
GLY-210
10.2
9.8
14.2
-22.5
129.7
108.8
-17.1
GLY-210
ASN-211
8.4
7.0
50.3
-15.3
90.8
105.8
-105.4
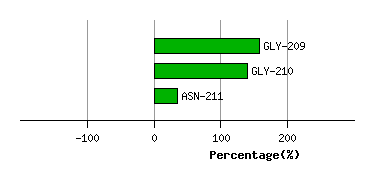
Graph shows rotational transition at bending residues and can be used
to identify hinge bending residues.
Probably only informative for interdomain rotations greater than 20 degrees
Residue
iResidue
i+1Distance of hinge axis to residue i in
(A) Distance of hinge axis to residue i in
(A) Change in
(deg) Change in
(deg) Angle of psi(i) axis to hinge axis
(deg) Angle of psi(i) axis to hinge axis
(deg) Percentage Progress
LEU-212
ASP-213
8.2
7.6
-7.7
7.0
148.4
148.5
-6.0
ASP-213
SER-214
6.0
6.0
3.1
-2.4
94.9
90.3
47.4
SER-214
LYS-215
2.7
3.2
9.5
-5.1
72.0
77.3
48.3
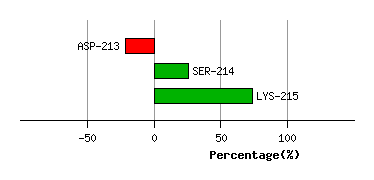
Graph shows rotational transition at bending residues and can be used
to identify hinge bending residues.
Probably only informative for interdomain rotations greater than 20 degrees