Glutamate Receptor Subunit 2
(All numbering and residues are taken from first PDB file)
![]()
![]()
Bending Residue Dihedral Analysis
Residue
iResidue
i+1Distance of hinge axis to residue i in
(A) Distance of hinge axis to residue i in
(A) Change in
(deg) Change in
(deg) Angle of psi(i) axis to hinge axis
(deg) Angle of psi(i) axis to hinge axis
(deg) Percentage Progress
PHE-106
MET-107
4.6
4.7
2.6
-0.2
97.8
100.0
8.7
MET-107
SER-108
2.9
3.1
-1.5
-6.0
9.4
9.3
158.0
SER-108
LEU-109
4.4
4.7
-8.7
4.8
73.5
73.1
-0.5

Graph shows rotational transition at bending residues and can be used
to identify hinge bending residues.
Probably only informative for interdomain rotations greater than 20 degrees
Residue
iResidue
i+1Distance of hinge axis to residue i in
(A) Distance of hinge axis to residue i in
(A) Change in
(deg) Change in
(deg) Angle of psi(i) axis to hinge axis
(deg) Angle of psi(i) axis to hinge axis
(deg) Percentage Progress
ASP-216
SER-217
4.8
4.8
4.2
-8.4
157.3
155.9
69.2
SER-217
LYS-218
5.1
5.0
21.3
-27.6
103.4
103.7
10.4
LYS-218
GLY-219
2.8
3.1
1.5
-0.2
176.7
177.1
-12.7

Graph shows rotational transition at bending residues and can be used
to identify hinge bending residues.
Probably only informative for interdomain rotations greater than 20 degrees
Residue
iResidue
i+1Distance of hinge axis to residue i in
(A) Distance of hinge axis to residue i in
(A) Change in
(deg) Change in
(deg) Angle of psi(i) axis to hinge axis
(deg) Angle of psi(i) axis to hinge axis
(deg) Percentage Progress
LYS-249
LEU-250
7.3
7.3
2.7
-1.4
96.0
96.9
-3.8
LEU-250
LYS-251
4.3
4.4
-1.4
-3.8
43.5
47.4
12.2
LYS-251
ASN-252
6.2
6.4
2.6
12.4
73.2
65.9
117.8
ASN-252
LYS-253
9.6
9.7
-11.1
2.5
133.2
127.9
-131.9
LYS-253
TRP-254
8.4
8.5
-0.8
-0.2
67.4
64.9
19.4
TRP-254
TRP-255
8.6
8.8
6.7
-5.4
137.0
135.9
9.1
TRP-255
TYR-256
10.7
10.9
-9.6
10.7
74.0
71.2
-111.4
TRP-255
TYR-256
10.7
10.9
-9.6
10.7
74.0
71.2
-111.4

Graph shows rotational transition at bending residues and can be used
to identify hinge bending residues.
Probably only informative for interdomain rotations greater than 20 degrees
Residue
iResidue
i+1Distance of hinge axis to residue i in
(A) Distance of hinge axis to residue i in
(A) Change in
(deg) Change in
(deg) Angle of psi(i) axis to hinge axis
(deg) Angle of psi(i) axis to hinge axis
(deg) Percentage Progress
TRP-255
TYR-256
10.7
10.9
-9.6
10.7
74.0
71.2
-111.4
TRP-255
TYR-256
10.7
10.9
-9.6
10.7
74.0
71.2
-111.4
TYR-256
ASP-257
13.5
13.6
-8.7
7.6
18.8
18.3
-26.1
ASP-257
LYS-258
13.6
13.4
-16.2
3.0
84.5
83.6
71.2
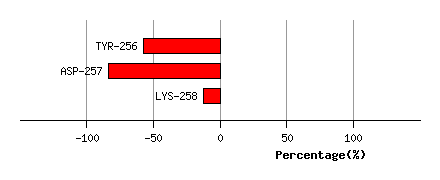
Graph shows rotational transition at bending residues and can be used
to identify hinge bending residues.
Probably only informative for interdomain rotations greater than 20 degrees