Probable Serine/threonine-Protein Kinase Pknb
(All numbering and residues are taken from first PDB file)
![]()
![]()
Bending Residue Dihedral Analysis
Residue
iResidue
i+1Distance of hinge axis to residue i in
(A) Distance of hinge axis to residue i in
(A) Change in
(deg) Change in
(deg) Angle of psi(i) axis to hinge axis
(deg) Angle of psi(i) axis to hinge axis
(deg) Percentage Progress
LEU-17
GLY-18
8.3
9.3
-8.9
9.5
138.3
152.8
-11.6
GLY-18
PHE-19
6.8
7.6
22.8
-14.4
107.2
97.0
-27.0
PHE-19
GLY-20
6.8
6.2
50.8
-49.8
31.9
26.2
9.5

Graph shows rotational transition at bending residues and can be used
to identify hinge bending residues.
Probably only informative for interdomain rotations greater than 20 degrees
Residue
iResidue
i+1Distance of hinge axis to residue i in
(A) Distance of hinge axis to residue i in
(A) Change in
(deg) Change in
(deg) Angle of psi(i) axis to hinge axis
(deg) Angle of psi(i) axis to hinge axis
(deg) Percentage Progress
MET-22
SER-23
7.6
7.2
18.7
7.7
29.8
31.8
105.9
SER-23
GLU-24
4.9
4.6
-17.2
16.8
94.3
96.4
-46.6
GLU-24
VAL-25
4.5
4.9
30.3
-27.0
68.7
70.0
7.3

Graph shows rotational transition at bending residues and can be used
to identify hinge bending residues.
Probably only informative for interdomain rotations greater than 20 degrees
Residue
iResidue
i+1Distance of hinge axis to residue i in
(A) Distance of hinge axis to residue i in
(A) Change in
(deg) Change in
(deg) Angle of psi(i) axis to hinge axis
(deg) Angle of psi(i) axis to hinge axis
(deg) Percentage Progress
ALA-38
VAL-39
6.8
6.6
12.7
-6.4
100.5
104.3
-2.3
VAL-39
LYS-40
3.5
3.1
-14.6
12.6
127.0
132.0
-9.8
LYS-40
VAL-41
1.3
0.5
-7.5
-8.8
56.9
61.4
35.9

Graph shows rotational transition at bending residues and can be used
to identify hinge bending residues.
Probably only informative for interdomain rotations greater than 20 degrees
Residue
iResidue
i+1Distance of hinge axis to residue i in
(A) Distance of hinge axis to residue i in
(A) Change in
(deg) Change in
(deg) Angle of psi(i) axis to hinge axis
(deg) Angle of psi(i) axis to hinge axis
(deg) Percentage Progress
ALA-60
GLN-61
10.5
9.7
10.2
-2.1
95.3
81.7
12.5
GLN-61
ASN-62
14.3
13.4
10.6
-30.2
156.8
144.3
94.5
ASN-62
ALA-63
14.4
13.5
13.1
32.1
101.7
101.4
-48.0
ALA-63
ALA-64
12.7
10.7
138.9
2.7
46.6
79.2
296.1
ALA-64
ALA-65
14.7
13.3
154.4
-20.7
107.6
56.8
-91.2
ALA-65
LEU-66
17.8
14.5
123.0
-17.0
122.3
115.2
-293.5
LEU-66
ASN-67
17.4
16.6
0.0
33.7
55.4
66.9
66.9

Graph shows rotational transition at bending residues and can be used
to identify hinge bending residues.
Probably only informative for interdomain rotations greater than 20 degrees
Residue
iResidue
i+1Distance of hinge axis to residue i in
(A) Distance of hinge axis to residue i in
(A) Change in
(deg) Change in
(deg) Angle of psi(i) axis to hinge axis
(deg) Angle of psi(i) axis to hinge axis
(deg) Percentage Progress
GLU-79
ALA-80
7.7
7.7
-12.4
10.8
21.6
29.6
6.6
ALA-80
GLU-81
6.3
6.5
-7.3
-8.1
83.1
80.7
76.8
GLU-81
THR-82
8.9
9.3
-15.6
40.9
86.5
77.9
-8.7

Graph shows rotational transition at bending residues and can be used
to identify hinge bending residues.
Probably only informative for interdomain rotations greater than 20 degrees
Residue
iResidue
i+1Distance of hinge axis to residue i in
(A) Distance of hinge axis to residue i in
(A) Change in
(deg) Change in
(deg) Angle of psi(i) axis to hinge axis
(deg) Angle of psi(i) axis to hinge axis
(deg) Percentage Progress
PRO-88
TYR-89
7.8
7.3
29.0
-28.5
110.9
113.9
0.8
TYR-89
ILE-90
4.8
4.3
2.9
2.7
110.8
102.9
20.3
ILE-90
VAL-91
5.8
5.1
5.8
-1.6
82.4
81.0
-8.1
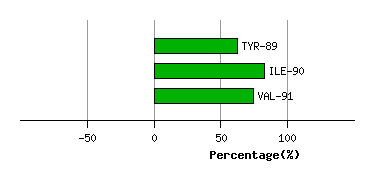
Graph shows rotational transition at bending residues and can be used
to identify hinge bending residues.
Probably only informative for interdomain rotations greater than 20 degrees