Cytochrome P450 2B4
(All numbering and residues are taken from first PDB file)
![]()
![]()
Bending Residue Dihedral Analysis
Residue
iResidue
i+1Distance of hinge axis to residue i in
(A) Distance of hinge axis to residue i in
(A) Change in
(deg) Change in
(deg) Angle of psi(i) axis to hinge axis
(deg) Angle of psi(i) axis to hinge axis
(deg) Percentage Progress
ARG-98
GLY-99
12.3
14.8
14.8
15.3
164.2
161.1
-88.0
GLY-99
LYS-100
11.5
14.2
-33.4
19.8
84.6
56.1
10.7
LYS-100
ILE-101
8.4
12.2
1.6
16.6
106.0
108.2
-1.4
ILE-101
ALA-102
8.1
9.0
1.3
-65.1
127.7
171.7
191.2
ALA-102
VAL-103
6.3
9.9
-171.4
1.3
97.7
58.9
102.2
VAL-103
VAL-104
6.4
8.1
147.3
14.2
39.3
108.8
263.5
VAL-104
ASP-105
4.4
10.6
-15.1
-8.1
90.7
26.2
-798.1
ASP-105
PRO-106
2.5
9.3
-162.8
-0.3
79.5
44.4
187.4
PRO-106
ILE-107
1.1
10.3
-14.8
9.0
145.3
77.2
-12.4
ILE-107
PHE-108
2.6
7.0
176.5
146.7
51.0
38.6
-77.5
PHE-108
GLN-109
1.4
8.0
67.6
-95.3
109.3
51.9
38.9
GLN-109
GLY-110
4.2
10.7
78.4
8.5
51.2
61.8
132.8
GLY-110
TYR-111
6.5
12.5
-25.4
50.5
152.0
108.1
44.9
TYR-111
GLY-112
5.5
10.7
-18.4
-179.5
125.5
163.5
466.2
GLY-112
VAL-113
3.5
10.6
-13.0
-56.8
107.4
91.7
-213.6
VAL-113
ILE-114
5.1
7.7
164.9
-70.6
122.4
23.4
126.5
ILE-114
PHE-115
6.2
8.6
-140.6
19.0
35.0
93.0
-375.0
PHE-115
ALA-116
6.3
8.8
130.1
17.9
93.1
109.5
119.4
ALA-116
ASN-117
8.3
11.9
165.9
34.8
88.6
45.6
204.7
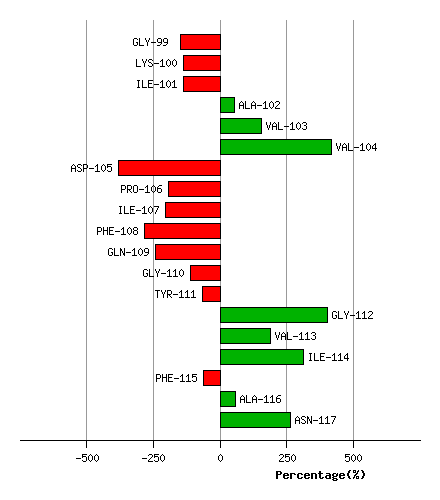
Graph shows rotational transition at bending residues and can be used
to identify hinge bending residues.
Probably only informative for interdomain rotations greater than 20 degrees
Residue
iResidue
i+1Distance of hinge axis to residue i in
(A) Distance of hinge axis to residue i in
(A) Change in
(deg) Change in
(deg) Angle of psi(i) axis to hinge axis
(deg) Angle of psi(i) axis to hinge axis
(deg) Percentage Progress
PHE-135
GLY-136
0.1
0.6
-97.8
-126.0
23.6
42.4
659.7
GLY-136
MET-137
1.7
3.1
-179.5
-2.5
49.8
29.4
-498.6
MET-137
GLY-138
1.6
1.4
23.1
10.7
93.3
111.2
-2.1
GLY-138
LYS-139
5.2
2.0
-167.7
16.4
141.5
30.8
100.2
LYS-139
ARG-140
5.7
2.8
146.4
11.8
93.6
80.1
90.7
ARG-140
SER-141
7.3
5.5
-16.7
-6.3
124.2
130.1
-46.3
SER-141
VAL-142
6.7
6.2
-9.1
-6.0
145.2
142.2
-32.8

Graph shows rotational transition at bending residues and can be used
to identify hinge bending residues.
Probably only informative for interdomain rotations greater than 20 degrees