Probable Butyrate Kinase 2
(All numbering and residues are taken from first PDB file)
![]()
![]()
Bending Residue Dihedral Analysis
Residue
iResidue
i+1Distance of hinge axis to residue i in
(A) Distance of hinge axis to residue i in
(A) Change in
(deg) Change in
(deg) Angle of psi(i) axis to hinge axis
(deg) Angle of psi(i) axis to hinge axis
(deg) Percentage Progress
VAL-130
VAL-131
11.8
11.6
8.9
-7.6
88.2
85.6
-43.7
VAL-131
VAL-132
10.2
10.0
7.4
-2.5
41.4
40.7
116.6
VAL-132
ASP-133
8.0
7.8
-2.5
-4.9
72.0
70.0
45.0

Graph shows rotational transition at bending residues and can be used
to identify hinge bending residues.
Probably only informative for interdomain rotations greater than 20 degrees
Residue
iResidue
i+1Distance of hinge axis to residue i in
(A) Distance of hinge axis to residue i in
(A) Change in
(deg) Change in
(deg) Angle of psi(i) axis to hinge axis
(deg) Angle of psi(i) axis to hinge axis
(deg) Percentage Progress
TYR-147
GLN-148
12.7
12.9
-18.9
9.0
36.8
40.9
134.4
GLN-148
ARG-149
10.2
10.3
8.8
-11.6
82.3
76.6
84.1
ARG-149
LYS-150
6.4
6.5
11.1
-19.4
133.6
139.0
159.4
LYS-150
SER-151
6.3
6.2
8.0
-6.4
98.5
94.8
-28.1
SER-151
ILE-152
4.5
4.4
10.2
-10.1
81.4
85.2
-35.1
ILE-152
PHE-153
7.1
7.3
4.5
-11.0
68.9
63.1
-85.1
PHE-153
HIS-154
7.8
8.2
-5.6
6.9
65.8
59.3
21.3
HIS-154
ALA-155
11.1
11.3
4.7
-6.0
161.2
150.5
26.5
ALA-155
LEU-156
10.1
10.0
8.6
-10.1
117.2
121.5
-61.6

Graph shows rotational transition at bending residues and can be used
to identify hinge bending residues.
Probably only informative for interdomain rotations greater than 20 degrees
Residue
iResidue
i+1Distance of hinge axis to residue i in
(A) Distance of hinge axis to residue i in
(A) Change in
(deg) Change in
(deg) Angle of psi(i) axis to hinge axis
(deg) Angle of psi(i) axis to hinge axis
(deg) Percentage Progress
ASN-157
GLN-158
15.0
14.6
4.0
-6.4
105.4
104.5
-2.5
GLN-158
LYS-159
12.0
11.6
-5.9
7.1
15.3
17.7
-28.2
LYS-159
THR-160
11.9
11.6
-7.3
6.6
73.6
76.2
53.5

Graph shows rotational transition at bending residues and can be used
to identify hinge bending residues.
Probably only informative for interdomain rotations greater than 20 degrees
Residue
iResidue
i+1Distance of hinge axis to residue i in
(A) Distance of hinge axis to residue i in
(A) Change in
(deg) Change in
(deg) Angle of psi(i) axis to hinge axis
(deg) Angle of psi(i) axis to hinge axis
(deg) Percentage Progress
LYS-171
ARG-172
19.0
18.9
1.9
0.9
88.5
89.0
172.1
ARG-172
TYR-173
15.3
15.3
-0.9
3.0
36.3
35.9
-56.2
TYR-173
GLU-174
13.1
13.1
-0.2
1.5
97.5
100.4
20.8

Graph shows rotational transition at bending residues and can be used
to identify hinge bending residues.
Probably only informative for interdomain rotations greater than 20 degrees
Residue
iResidue
i+1Distance of hinge axis to residue i in
(A) Distance of hinge axis to residue i in
(A) Change in
(deg) Change in
(deg) Angle of psi(i) axis to hinge axis
(deg) Angle of psi(i) axis to hinge axis
(deg) Percentage Progress
LEU-178
VAL-179
13.0
13.0
3.4
0.3
37.6
39.2
-15.0
VAL-179
VAL-180
11.9
11.8
5.5
-6.4
69.6
74.3
-36.6
VAL-180
ALA-181
11.9
11.9
-8.8
13.4
148.7
150.2
110.1
ALA-181
HIS-182
11.8
11.9
2.6
-6.4
100.9
97.5
-18.7
ALA-181
HIS-182
11.8
11.9
2.6
-6.4
100.9
97.5
-18.7
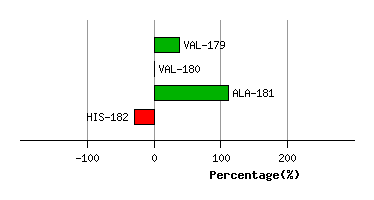
Graph shows rotational transition at bending residues and can be used
to identify hinge bending residues.
Probably only informative for interdomain rotations greater than 20 degrees
Residue
iResidue
i+1Distance of hinge axis to residue i in
(A) Distance of hinge axis to residue i in
(A) Change in
(deg) Change in
(deg) Angle of psi(i) axis to hinge axis
(deg) Angle of psi(i) axis to hinge axis
(deg) Percentage Progress
ALA-181
HIS-182
11.8
11.9
2.6
-6.4
100.9
97.5
-18.7
ALA-181
HIS-182
11.8
11.9
2.6
-6.4
100.9
97.5
-18.7
GLY-184
GLY-185
15.1
15.1
10.8
-21.8
133.2
142.0
178.1

Graph shows rotational transition at bending residues and can be used
to identify hinge bending residues.
Probably only informative for interdomain rotations greater than 20 degrees
Residue
iResidue
i+1Distance of hinge axis to residue i in
(A) Distance of hinge axis to residue i in
(A) Change in
(deg) Change in
(deg) Angle of psi(i) axis to hinge axis
(deg) Angle of psi(i) axis to hinge axis
(deg) Percentage Progress
GLY-331
SER-332
21.3
21.3
12.5
-25.6
135.8
135.4
161.3
SER-332
ASN-333
19.8
20.3
60.4
-57.9
120.8
107.4
-8.5
ASN-333
GLU-334
22.4
22.4
-7.7
21.3
56.4
57.9
-136.7

Graph shows rotational transition at bending residues and can be used
to identify hinge bending residues.
Probably only informative for interdomain rotations greater than 20 degrees
Residue
iResidue
i+1Distance of hinge axis to residue i in
(A) Distance of hinge axis to residue i in
(A) Change in
(deg) Change in
(deg) Angle of psi(i) axis to hinge axis
(deg) Angle of psi(i) axis to hinge axis
(deg) Percentage Progress
ARG-361
TRP-362
11.3
11.1
-15.2
6.2
33.1
28.2
169.3
TRP-362
ARG-363
10.1
10.0
3.3
-6.7
117.6
119.6
53.2
ARG-363
GLU-364
13.4
13.3
-6.1
6.9
116.7
114.4
4.6

Graph shows rotational transition at bending residues and can be used
to identify hinge bending residues.
Probably only informative for interdomain rotations greater than 20 degrees