Udp-Galactose 4-Epimerase
(All numbering and residues are taken from first PDB file)
![]()
![]()
Bending Residue Dihedral Analysis
Residue
iResidue
i+1Distance of hinge axis to residue i in
(A) Distance of hinge axis to residue i in
(A) Change in
(deg) Change in
(deg) Angle of psi(i) axis to hinge axis
(deg) Angle of psi(i) axis to hinge axis
(deg) Percentage Progress
ALA-222
LEU-223
3.2
3.0
4.8
-32.8
144.9
163.9
133.1
LEU-223
ASN-224
3.8
2.9
-30.8
24.4
87.5
78.7
0.6
ASN-224
VAL-225
6.4
5.6
8.4
-30.5
165.7
167.1
67.8

Graph shows rotational transition at bending residues and can be used
to identify hinge bending residues.
Probably only informative for interdomain rotations greater than 20 degrees
Residue
iResidue
i+1Distance of hinge axis to residue i in
(A) Distance of hinge axis to residue i in
(A) Change in
(deg) Change in
(deg) Angle of psi(i) axis to hinge axis
(deg) Angle of psi(i) axis to hinge axis
(deg) Percentage Progress
VAL-238
ARG-239
3.6
3.4
3.2
0.3
59.7
68.7
-0.1
ARG-239
ASP-240
2.6
2.1
23.4
-21.8
64.2
63.9
42.7
ASP-240
TYR-241
3.2
3.3
20.6
-39.8
116.8
114.6
22.3
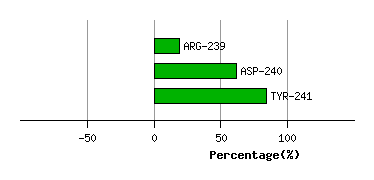
Graph shows rotational transition at bending residues and can be used
to identify hinge bending residues.
Probably only informative for interdomain rotations greater than 20 degrees
Residue
iResidue
i+1Distance of hinge axis to residue i in
(A) Distance of hinge axis to residue i in
(A) Change in
(deg) Change in
(deg) Angle of psi(i) axis to hinge axis
(deg) Angle of psi(i) axis to hinge axis
(deg) Percentage Progress
TYR-275
SER-276
2.7
3.2
-7.8
-3.7
127.4
134.4
-35.5
SER-276
VAL-277
2.9
3.6
-7.6
0.8
146.2
151.4
-21.5
VAL-277
LEU-278
1.6
2.2
4.6
6.9
52.8
60.5
12.7
LEU-278
GLN-279
3.8
5.7
-10.0
7.1
68.9
74.1
3.5

Graph shows rotational transition at bending residues and can be used
to identify hinge bending residues.
Probably only informative for interdomain rotations greater than 20 degrees
Residue
iResidue
i+1Distance of hinge axis to residue i in
(A) Distance of hinge axis to residue i in
(A) Change in
(deg) Change in
(deg) Angle of psi(i) axis to hinge axis
(deg) Angle of psi(i) axis to hinge axis
(deg) Percentage Progress
LYS-295
VAL-296
6.0
5.2
-45.0
15.8
37.3
37.0
97.9
VAL-296
VAL-297
8.6
7.8
-4.3
1.3
104.1
99.2
-12.7
VAL-297
ALA-298
11.2
10.6
-19.6
6.0
33.2
34.9
54.6

Graph shows rotational transition at bending residues and can be used
to identify hinge bending residues.
Probably only informative for interdomain rotations greater than 20 degrees
Residue
iResidue
i+1Distance of hinge axis to residue i in
(A) Distance of hinge axis to residue i in
(A) Change in
(deg) Change in
(deg) Angle of psi(i) axis to hinge axis
(deg) Angle of psi(i) axis to hinge axis
(deg) Percentage Progress
CYS-307
TYR-308
5.3
5.0
-8.8
-7.0
96.9
101.8
-45.9
TYR-308
ALA-309
2.5
2.6
0.4
0.6
15.9
15.7
-16.9
ALA-309
ASN-310
3.3
4.0
-6.9
19.5
135.4
133.0
92.8

Graph shows rotational transition at bending residues and can be used
to identify hinge bending residues.
Probably only informative for interdomain rotations greater than 20 degrees