Protease Synthase And Sporulation Negative Regulatory Protein Pai 1
(All numbering and residues are taken from first PDB file)
![]()
![]()
Bending Residue Dihedral Analysis
Residue
iResidue
i+1Distance of hinge axis to residue i in
(A) Distance of hinge axis to residue i in
(A) Change in
(deg) Change in
(deg) Angle of psi(i) axis to hinge axis
(deg) Angle of psi(i) axis to hinge axis
(deg) Percentage Progress
PHE-62
PHE-63
7.7
7.7
2.7
-3.8
23.3
22.6
0.8
PHE-63
ILE-64
7.7
7.8
-2.5
-0.5
110.9
111.4
-4.6
ILE-64
TYR-65
5.6
5.6
-2.2
4.6
166.9
166.4
13.8
TYR-65
PHE-66
6.8
6.9
-5.1
6.4
122.4
124.3
31.4
PHE-66
ASP-67
6.0
5.8
-21.5
-2.6
145.8
145.9
-210.5

Graph shows rotational transition at bending residues and can be used
to identify hinge bending residues.
Probably only informative for interdomain rotations greater than 20 degrees
Residue
iResidue
i+1Distance of hinge axis to residue i in
(A) Distance of hinge axis to residue i in
(A) Change in
(deg) Change in
(deg) Angle of psi(i) axis to hinge axis
(deg) Angle of psi(i) axis to hinge axis
(deg) Percentage Progress
ALA-71
GLY-72
4.2
4.2
0.2
-1.6
140.4
140.3
8.5
GLY-72
TYR-73
4.8
5.0
6.2
-3.0
147.2
147.9
-33.6
TYR-73
VAL-74
5.4
5.6
0.6
-1.1
141.4
140.7
9.6
VAL-74
LYS-75
4.4
4.5
2.8
-0.6
135.9
137.0
-9.0

Graph shows rotational transition at bending residues and can be used
to identify hinge bending residues.
Probably only informative for interdomain rotations greater than 20 degrees
Residue
iResidue
i+1Distance of hinge axis to residue i in
(A) Distance of hinge axis to residue i in
(A) Change in
(deg) Change in
(deg) Angle of psi(i) axis to hinge axis
(deg) Angle of psi(i) axis to hinge axis
(deg) Percentage Progress
ALA-81
GLN-82
10.1
10.4
-7.6
7.0
111.8
110.9
-27.4
GLN-82
SER-83
8.4
8.7
-7.1
8.1
89.6
89.2
-20.4
SER-83
GLU-84
11.4
11.8
-6.2
5.6
45.1
42.9
19.4

Graph shows rotational transition at bending residues and can be used
to identify hinge bending residues.
Probably only informative for interdomain rotations greater than 20 degrees
Residue
iResidue
i+1Distance of hinge axis to residue i in
(A) Distance of hinge axis to residue i in
(A) Change in
(deg) Change in
(deg) Angle of psi(i) axis to hinge axis
(deg) Angle of psi(i) axis to hinge axis
(deg) Percentage Progress
GLU-92
ILE-93
4.0
4.3
1.5
-4.7
162.2
162.7
30.8
ILE-93
GLU-94
4.0
4.3
0.7
-0.4
98.4
100.1
20.5
GLU-94
ARG-95
7.5
7.8
3.4
-8.9
162.4
163.9
69.7
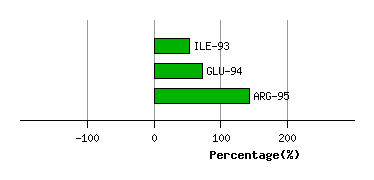
Graph shows rotational transition at bending residues and can be used
to identify hinge bending residues.
Probably only informative for interdomain rotations greater than 20 degrees
Residue
iResidue
i+1Distance of hinge axis to residue i in
(A) Distance of hinge axis to residue i in
(A) Change in
(deg) Change in
(deg) Angle of psi(i) axis to hinge axis
(deg) Angle of psi(i) axis to hinge axis
(deg) Percentage Progress
ASN-100
SER-101
7.6
7.6
3.1
-3.8
47.5
46.6
-46.4
SER-101
PHE-102
5.1
5.2
7.8
-12.1
110.7
111.0
22.6
PHE-102
GLN-103
2.3
2.5
-2.8
0.6
51.3
48.1
40.2

Graph shows rotational transition at bending residues and can be used
to identify hinge bending residues.
Probably only informative for interdomain rotations greater than 20 degrees
Residue
iResidue
i+1Distance of hinge axis to residue i in
(A) Distance of hinge axis to residue i in
(A) Change in
(deg) Change in
(deg) Angle of psi(i) axis to hinge axis
(deg) Angle of psi(i) axis to hinge axis
(deg) Percentage Progress
HIS-110
LEU-111
5.4
5.3
2.8
-1.5
46.8
48.5
21.0
LEU-111
LEU-112
2.2
2.1
-0.4
1.9
152.9
154.2
15.1
LEU-112
ASN-113
3.3
3.2
1.3
4.1
60.0
60.8
54.4

Graph shows rotational transition at bending residues and can be used
to identify hinge bending residues.
Probably only informative for interdomain rotations greater than 20 degrees
Residue
iResidue
i+1Distance of hinge axis to residue i in
(A) Distance of hinge axis to residue i in
(A) Change in
(deg) Change in
(deg) Angle of psi(i) axis to hinge axis
(deg) Angle of psi(i) axis to hinge axis
(deg) Percentage Progress
GLU-121
ARG-122
9.9
9.5
-6.7
5.4
39.2
35.0
17.8
ARG-122
ASN-123
7.6
7.3
-2.5
5.6
37.2
40.8
-10.1
ASN-123
LYS-124
7.7
7.4
-10.3
13.2
74.4
77.7
10.6
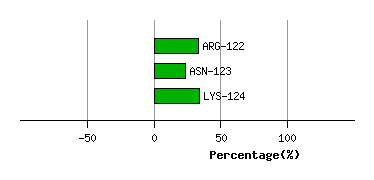
Graph shows rotational transition at bending residues and can be used
to identify hinge bending residues.
Probably only informative for interdomain rotations greater than 20 degrees
Residue
iResidue
i+1Distance of hinge axis to residue i in
(A) Distance of hinge axis to residue i in
(A) Change in
(deg) Change in
(deg) Angle of psi(i) axis to hinge axis
(deg) Angle of psi(i) axis to hinge axis
(deg) Percentage Progress
GLN-149
THR-150
15.9
16.0
4.9
-1.2
12.2
13.0
41.4
THR-150
GLY-151
15.5
15.8
-2.3
-8.0
109.4
109.0
-26.0
GLY-151
ALA-152
17.0
17.4
14.2
14.0
140.0
137.3
-227.9
ALA-152
HIS-153
18.8
18.6
13.2
-5.0
61.9
62.6
34.3
HIS-153
SER-154
20.1
18.8
-25.2
4.0
43.7
46.4
180.1
SER-154
PHE-155
22.4
21.3
5.2
-4.0
91.3
94.7
9.8
PHE-155
TYR-156
21.8
21.0
5.7
-11.8
133.3
129.2
41.3
GLY-158
ASP-159
26.2
26.2
-6.0
11.1
130.9
133.5
54.8
ASP-159
GLU-160
29.3
29.0
-7.9
31.3
104.9
89.6
37.7
GLU-160
GLU-161
28.4
27.7
-28.7
4.3
117.3
125.4
-155.6
GLU-161
GLN-162
26.3
26.0
-11.7
9.0
56.1
62.1
-2.6
GLN-162
THR-163
23.5
23.2
-1.6
-9.3
133.7
134.5
-78.9

Graph shows rotational transition at bending residues and can be used
to identify hinge bending residues.
Probably only informative for interdomain rotations greater than 20 degrees